Environmental Engineering Reference
In-Depth Information
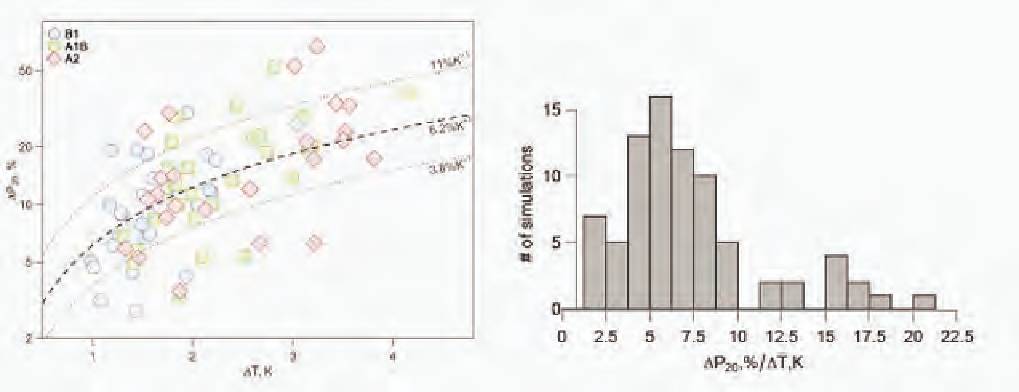
FIGURE 4.10 Relative changes in 20-year return values averaged over the global land area of annual 24-h precipitation maxima (
Δ
P
20) as
a function of globally averaged changes in mean surface temperature for B1, A1B, and A2 global emissions scenarios, with results pooled
from 14 GCM runs and for 2046-2065 and 2081-2100 relative to 1981-2000. In the left panel, the pooled results are shown along with the
median slope of 6.2% per °C and the 15th and 85th percentiles (dashed and dotted lines, respectively). The right panel shows the results as
a histogram. Source: Replotted from Kharin et al. (2007, Figure 16).