Environmental Engineering Reference
In-Depth Information
% summers warmer than current 95th percentile
1C global average warming
% summers warmer than current warmest anomaly
1C global average warming
% summers warmer than current 95th percentile
2C global average warming
100
100
100
90
90
90
50
50
50
70
70
70
0
50
0
50
0
50
−50
−50
−50
10
10
10
0
0
0
−150 −100 −50 0 50 100 150
−150 −100 −50 0 50 100 150
−150 −100 −50 0 50 100 150
% summers warmer than current 95th percentile
3C global average warming
% summers warmer than current warmest anomaly
2C global average warming
% summers warmer than current warmest anomaly
3
C
global
average warmi
n
g
100
100
100
90
90
90
50
50
50
70
70
70
0
50
0
50
0
50
−50
−50
−50
10
10
10
0
0
0
−150 −100 −50 0 50 100 150
−150 −100 −50 0 50 100 150
−150 −100 −50 0 50 100 150
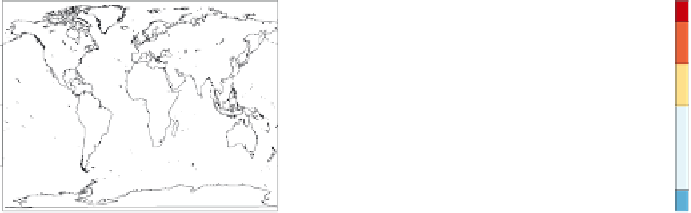
FIGURE 4.9 Chances that June-July-August average temperatures will be warmer than the 5th percentile of the climatological distribution
(1971-2000)—left column—and warmer than the warmest (boreal) summer in the climatological distribution—right column—for different
degrees of global annual average warming (1°C, 2°C, and 3°C, respectively, along the three rows). Global average warming is calculated with
respect to 1971-2000 averages. To obtain warming with respect to pre-industrial add 0.8°C.