Environmental Engineering Reference
In-Depth Information
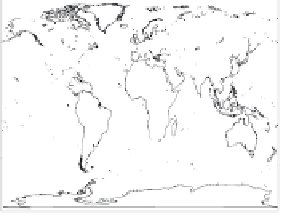
DJF Pattern, Range by Scen.
Annual Pattern, Range by Scen.
JJA Pattern, Range by Scen.
1.00
1.00
1.00
50
50
50
0.75
0.75
0.75
0
0.50
0
0.50
0
0.50
0.40
0.40
0.40
0.30
0.30
0.30
−50
−50
−50
0.20
0.20
0.20
0.15
0.15
0.15
0.10
0.10
0.10
0.05
0.05
0.05
0.00
0.00
0.00
−150 −100 −50 0 50 100 150
−150 −100 −50 0 50 100 150
−150 −100 −50 0 50 100 150
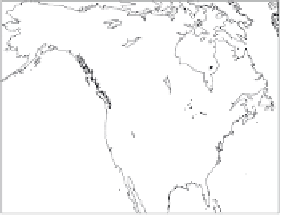
Annual Pattern, Range by Scen.
DJF Pattern, Range by Scen.
JJA Pattern, Range by Scen.
0.40
0.40
0.40
70
70
70
60
60
60
0.30
0.30
0.30
50
50
50
0.20
0.20
0.20
0.15
0.15
0.15
40
40
40
0.10
0.10
0.10
30
0.05
30
30
0.05
0.05
0.00
0.00
0.00
−160 −140 −120 −100 −80 −60
−160 −140 −120 −100 −80 −60
−160 −140 −120 −100 −80 −60
FIGURE 4.5 For the same patterns as in Figure 4.1, the range across SRES A1B, A2, and B1 of the patterns derived as a multi-model ensemble
is shown as a measure of the variability of the patterns under different emission scenarios.