Environmental Engineering Reference
In-Depth Information
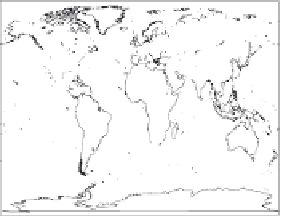
Annual Pattern, Range by Mod.
DJF Pattern, Range by Mod.
JJA Pattern, Range by Mod.
9.0
9.0
9.0
8.0
8.0
8.0
50
7.0
50
7.0
7.0
50
6.0
6.0
6.0
5.0
5.0
5.0
0
0
0
4.0
4.0
4.0
3.0
3.0
3.0
2.5
2.5
2.5
2.0
−50
2.0
−50
2.0
−50
1.5
1.5
1.5
1.0
1.0
1.0
0.5
0.5
0.5
0.0
0.0
0.0
−150 −100 −50 0 50 100 150
−−150 −100 −50 0 50 100 150
−150 −100 −50 0 50 100 150
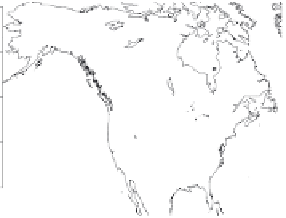
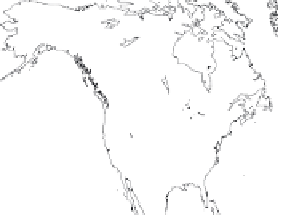
Annual Pattern, Range by Mod.
DJF Pattern, Range by Mod.
JJA Pattern, Range by Mod.
9.0
9.0
9.0
70
70
70
8.0
8.0
8.0
7.0
7.0
7.0
60
60
60
6.0
6.0
6.0
5.0
50
5.0
50
5.0
50
4.0
4.0
4.0
40
40
40
3.0
3.0
3.0
2.5
2.5
2.5
2.0
2.0
2.0
1.5
1.5
1.5
30
30
30
1.0
1.0
1.0
0.5
0.5
0.5
0.0
0.0
0.0
−160 −140 −120 −100 −80 −60
−160 −140 −120 −100 −80 −60
−160 −140 −120 −100 −80 −60
FIGURE 4.4 For the same patterns as in Figure 4.1, the range across the 18 models of the average of each model's patterns obtained under
the three different scenarios is shown as a measure of the variability of the patterns produced by different GCMs.