Environmental Engineering Reference
In-Depth Information
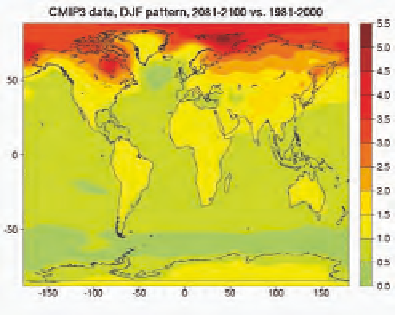
FIGURE 4.1 Geographical patterns of warming per 1°C of global annual average warming, over the whole world (top) and over North America
(bottom). From left to right: patterns for average temperature over the whole calendar year or for average temperature in boreal winter (De-
cember, January, and February) or summer (June, July, and August). Patterns are obtained by scaling end-of-21st-century changes (compared
to end-of-20th-century climatology) by global average annual warming over the same period, using temperature at the surface from the 18
CMIP3 models whose output is available for SRES scenarios A2, A1B, and B1.