Environmental Engineering Reference
In-Depth Information
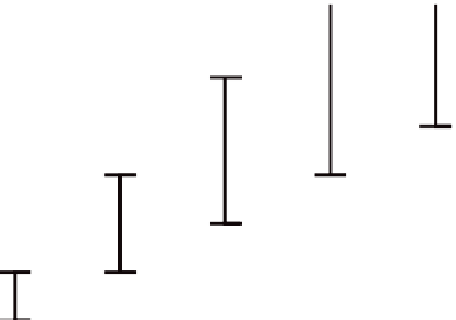
Emitted
to date
Global Mean Temperature Change (°C)
FIGURE 3.6 Cumulative carbon emissions consistent with global mean temperature changes of 1 to 5°C.
Best estimates are based on 1.75°C per 1,000 GtC emitted, taken as a representative best estimate from
Matthews et al. (2009) and Allen et al. (2009).
Likely
uncertainty ranges of 70-140% of the best estimate are
based on Zickfeld et al. (2009) and Matthews et al. (2009). The dashed line shows cumulative emission to
the year 2009 (530 GtC).
it to other warming levels based on a combination of the results of Zickfeld
et al. (2009) and Matthews et al. (2009). Matthews et al. (2009) presented a
5-95% uncertainty range of 1,000 to 1,900 GtC on emissions for 2°C, based
on a central estimate of 1400 GtC; this corresponds to a uncertainty range
of approximately 70-140% of the central estimate. Zickfeld et al. (2009) also
provided an uncertainty range for the cumulative emissions associated with
2, 3, and 4°C global mean temperature change, and found that the relative
uncertainty scaled approximately with the median value. Based on this, we
use the relative uncertainty range from Matthews et al. (2009) and apply
this to our central estimate of emissions consistent with each temperature
target. For 2 degrees, this represents a best estimate of 1,150 GtC, with an
uncertainty range of 800 to 1,600 GtC (Figure 3.6), which we adopt here
as the
likely
range of emissions for 2°C global warming.
While global mean temperature change is well constrained by cumula-
tive emissions, this cumulative carbon framework is less consistent with the
more widely used framework of CO
2
concentration stabilization. A given