Environmental Engineering Reference
In-Depth Information
4
BERN-CC
CSM-1
CLIMBER2-LPJ
FRCGC
HADCM3LC
IPSL-CM2C
IPSL-CM4-LOOP
LLNL
MPI
UMD
UVIC-2.7
MODEL MEAN
3
2
1
Observationally constained best estimate
Observational 5-95% uncertainty
0
1900
1950
2000
2050
2100
Year
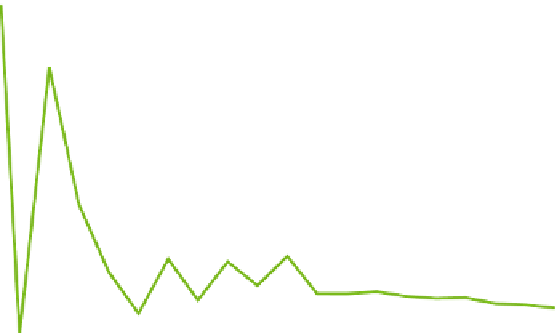
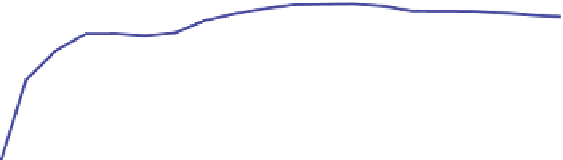
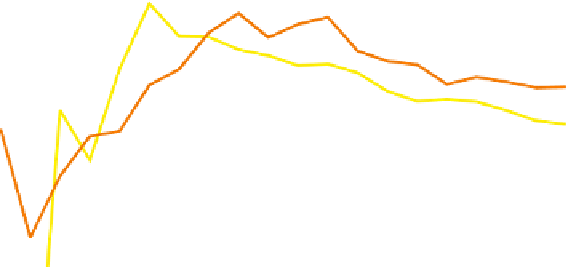
FIGURE 3.5 Temperature response to cumulative carbon emissions from coupled climate-carbon model
simulations (thin colored lines) and historical observations of CO
2
-induced warming and anthropogenic
CO
2
emissions (thick black line solid and dotted lines). (Figure adapted from Figures 3 and 4 of Matthews
et al., 2009).
estimate of 1.5°C/1,000 GtC emitted based on observational constraints, and
1.6°C/1,000 GtC based on the model average. Allen et al. (2009), using a
simpler climate model but considering a larger range of climate sensitivity,
found a most likely peak temperature response of 2°C/1,000 GtC, with a
5-95% confidence range of 1.3-3.9°C/1,000 GtC. Allen et al. also provided
an estimate for the
instantaneous
temperature response to cumulative emis-
sions (corresponding to the definition of the carbon-climate response from
Matthews et al.) of 1.4-2.5°C/1,000 GtC. Both Matthews et al. (2009) and
Allen et al. (2009) concluded that the temperature response to cumulative
emissions is remarkably constant over time and over a wide range of CO
2
emissions scenarios. Based on this, they provided best estimates of the al-
lowable emissions for 2°C global temperature increase of 1,000 GtC (Allen
et al., 2009) and 1,300 GtC (Matthews et al., 2009).
Zickfeld et al. (2009) also presented an estimate of the cumulative emis-
sions required to meet a 2°C temperature target. The authors considered both
climate sensitivity uncertainty and the uncertainty in climate-carbon feed-