Information Technology Reference
In-Depth Information
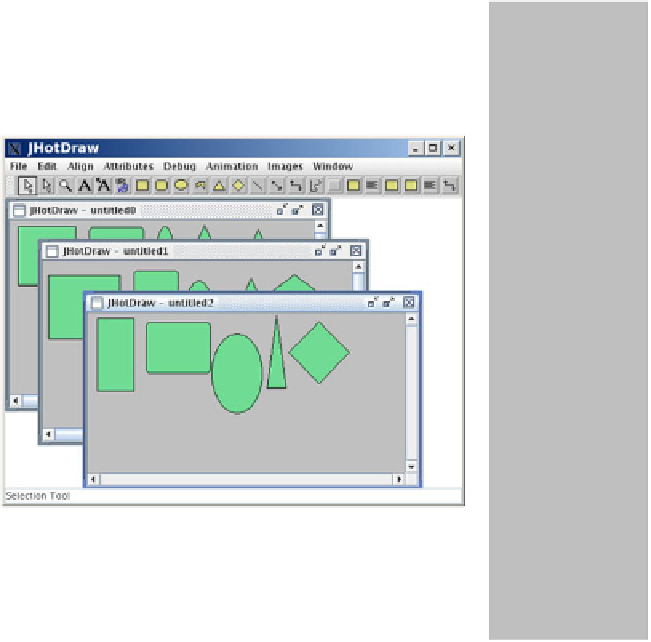
Fig. 6.
Screenshot from JHotDraw along with phase-visualisation of the trace [29]
In practice, a trace is not just an homogeneous series of calls to different
methods. It consists of patterns; processing of text file might contain a loop
to read in characters that causes the repetition of a few specific methods for a
long period of time, followed by a different loop of method calls to display these
characters etc. These
phases
of activity tend to correspond to high-level units
of behaviour, and are what we are looking to identify from these traces for our
purpose of trace abstraction.
The solution lies in the identification of those 'segments' of the trace that
correspond to a particular item of functionality (i.e. rendering a figure). In the
trace-analysis community this is refered to as
phase analysis
. Phase analysis is
an established problem [29]. Current solutions rely on visualisation techniques.
The trace is visualised as a vast message sequence chart, which is compressed
into a bitmap that fits to the screen. As an example see the trace-visualisation
produced by Cornelissen
et al.
to the right in Figure 6. Despite the size of the
trace, it is clear that the trace consists of distinct phases of activity. The three
repeated actions of drawing figures on the three canvasses is clearly visible in
the visualisation.