Database Reference
In-Depth Information
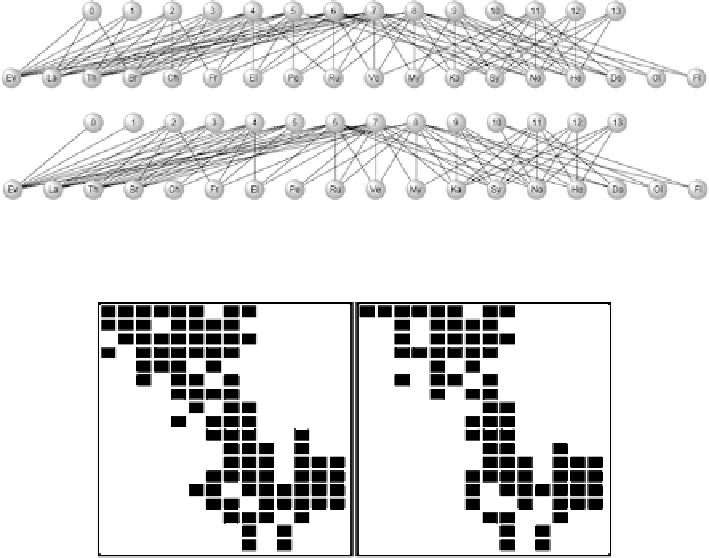
characteristics as a lot of data from CBD. It contains information about the partici-
pation of 18 women in 14 social events during the season. This participation can be
considered as a two-mode network or as a formal context (binary matrix with rows
as women and columns as social events). The visualization of this network as
bipartite graph can be seen in the upper part of Fig.
3.17
. Events are represented
by nodes in the first row. These nodes are labeled by the event numbers. The second
row contains nodes representing women. These nodes are labeled by the first two
letters of their names. Participation of the women in the event is represented by an
edge between corresponding nodes. An illustration of the formal context (resp.
binary matrix) can be seen in the left part of Fig.
3.18
.
Now we will describe the computed Galois lattice (Fig.
3.9
). Each node in the
graph represents one formal concept. Every concept is a set of objects (women, in
this case) and set of corresponding attributes (events). Edges express the ordering of
concepts. The aforementioned reduced labeling is used here. The lattice contains all
combinations of objects and attributes present in the data. One can easily read that
Sylvia participated in all events that Katherine did. Everyone who participated in
events 13 and 14 also participated in event 10. The reasons for these nodes to be
separate are the women Dorothy and Myrna, who took part in event 10 but not in the
events 13 and 14.
Fig. 3.17 Social network - visualized as bipartite graph before and after reduction to rank 5
Fig. 3.18 Context visualization (original, rank 5)
Search WWH ::

Custom Search