Database Reference
In-Depth Information
components are presented in Table
5.3
. The nodes of the three tag graphs appear to
have a high clustering coefficient on average, which indicates the existence of
community structure in them. We applied both community detection methods,
CNM and HCD, on the tag graphs and proceeded with the analysis of the derived
communities.
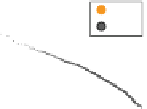
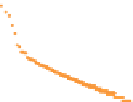
First, we present a comparison of the sizes of the detected communities.
Figure
5.5
presents the rank plots of the communities detected by CNM and HCD
based on their size. It is evident that CNM produces communities with much more
skewed size distribution than HCD. For instance, the three largest communities of
the BIBSONOMY-200K tag network together comprise a total of 10,625 tags,
accounting for approximately 89% of all unique tags of this graph. By contrast,
the communities produced by HCD have a much more balanced size distribution,
with the largest community of BIBSONOMY-200K consisting of just 38 nodes.
A similar situation holds also for the other two datasets.
When considering the applications of tag community detection (see Sect.
5.2.5
),
it is hard to imagine that the highly imbalanced community structure produced by
CNM can be of much benefit. For instance, knowing that two tags belong to the
same huge community is not very informative of their semantic relation; in fact,
there are many pairs of tags within such huge communities that are not actually
related to each other. Table
5.4
presents several such examples of unrelated tags
which were placed in the same community. Having these tags in the same commu-
nity is not only uninformative but is actually misleading and thus potentially
harmful for use within some information retrieval task. By contrast, Table
5.5
presents several examples of interesting tag communities discovered by HCD.
Table 5.3 Basic graph statistics for the large component of the examined tag graphs
Dataset
k
|
V
|
|
E
|
cc
BIBSONOMY-200K
11,949
236,791
39.63
0.6689
FLICKR-1M
27,521
693,412
50.39
0.8512
DELICIOUS-7M
216,844
3,443,367
31.76
0.8018
a
b
c
10
4
10
4
10
5
CNM
CNM
HCD
CNM
10
4
10
3
10
3
HCD
HCD
10
3
10
2
10
2
10
2
10
1
10
1
10
1
10
0
10
0
10
0
10
0
10
1
10
2
10
3
10
4
10
0
10
1
10
2
10
3
10
4
10
0
10
1
10
2
10
3
10
4
Rank
Rank
Rank
BIBSONOMY-200K
FLICKR-1M
DELICIOUS-7M
Fig. 5.5 Size distribution of the communities detected by CNM and HCD. Across all three
datasets, CNM produces communities with a much more skewed size distribution than HCD


Search WWH ::

Custom Search