Agriculture Reference
In-Depth Information
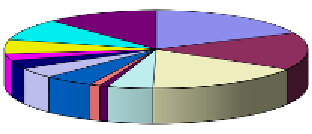
Because there are significant differences in the uptake of nutrients by different crops,
their impact on fertilizer consumption could be higher for certain crops than for others
(Figure 2).
Table 4. Consumption of different N fertilizers by regions (average 2007-2011)
Consumption
(,000 ton)
A
B
C
D
E
F
G
H
Asia
-
376.8
4,626.00
1,369.0
471.1
44,786.2
4,046.4
15.4
West and
central
Europe
4.4
2,049.0
212.0
321.4
2,476.2
1,620.0
1,574.4
1,161.8
Africa
598.0
152.0
94.2
134.2
1,439.8
609.6
0.6
Latin
America
44.8
605.4
655.4
813.6
68.4
3,454.4
473.0
176.8
East Europe
1,290.0
101.2
118.4
18.8
470.4
284.8
158.2
Oceania
32.2
11.4
180.0
97.6
3.96
782.2
66.8
101.4
North
America
3,691.0
282.0
782.0
365.8
17.54
3,287
998.4
3,244.8
(A) Ammonia; (B) Ammonium nitrate; (C) Ammonium phosphate; (D) Ammonium sulfate, (E)
Calcium ammonium nitrate; (F) Urea; (G) NPK; (H) Nitrogen solution.
According to estimates of the IFA (IFA - FUBC assessment 2010) nitrogen applied to
cereals, amounting up to 57.5 Mt, represents 55.2% of the global N-fertilizer consumption in
2010-11 (18.1% wheat, 16.8% maize, 15.4% rice, 4.8% other cereals). Oil crops contributed
7.3%, cotton 4.3%, sugar crops 3.5% and root & tubers 2.8%. Fruits and vegetables
accounted 14.9% of the total, and other crops for 12.0%.
wheat
rice
maize
other cereals
soybean
oil palm
other oilseeds
fibre crops
9.1%
12.0%
18.1%
5.8%
15.4%
16.8%
2.8%
3.5%
4.3%
sugar crops
roots/tubers
fruits
vegetables
other crops
4.8%
5.3%
1.1%
0.9%
Figure 2. N-fertilizer use by crops at the global level (IFA, 2013).


Search WWH ::

Custom Search