Environmental Engineering Reference
In-Depth Information
4.5
100%
4.1
97%
90%
4.0
93%
80%
79%
3.5
70%
3.0
60%
58%
2.5
50%
2.0
40%
1.5
1.5
30%
1.0
1.0
20%
0.5
10%
0.3
0.2
0%
0.0
Fermentation
and
clarification
Wort
production
Auxiliary
processes
Malting
Packing
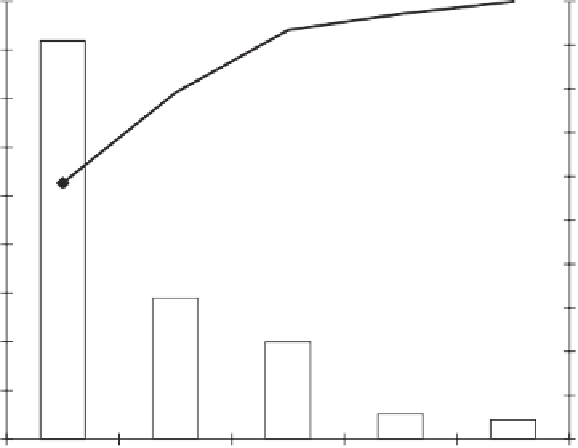
Figure 5.6
Pareto diagram for consumption of water for the beer example constructed with data
presented in Table 5.2.
Identifying the main burdens
It is obvious from Figure 5.5 that in terms of energy expenditure, auxiliary processes is the
step with highest impact and requires immediate attention. It is likely that auxiliary processes
contains several internal substeps that would require a deeper analysis; and at the end, a Pareto
diagram could be built for just this particular step.
In terms of water consumption, fermentation and clarification is the step with the highest
consumption of water (Fig. 5.6). Almost 60 percent of the total water used in the whole pro-
cess takes place during fermentation and clarification. If wort production is added, both
account for almost 80 percent of the whole water consumption.
Starting with the low-hanging fruit instead
Often it is suggested to start working on sustainability with the low-hanging fruit instead of
tackling the main burdens as was proposed previously. That is an acceptable route, as long as
these lesser concerns do not become the
only
focus of the sustainability initiative. Sometimes
starting with easy problems that do not require capital expenditure is a good way to gain
support from upper management on a sustainability initiative. However, long-term
sustainability can only work it a plan includes the support of all players, especially upper
administration.
Efficiency improvements using the Plan-Do-Check-Act cycle
Efficiency improvements can be performed in a four-step approach using the Plan-Do-Check-
Act (PDCA) cycle (Fig. 5.7). The PDCA cycle is a popular management tool used for
introduction and implementation of improvements in a system. The Plan phase consist of