Environmental Engineering Reference
In-Depth Information
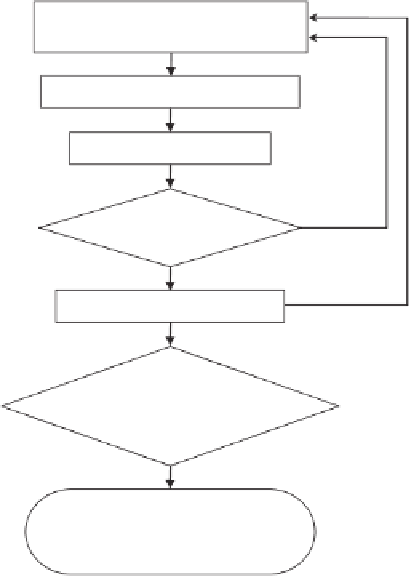
Map the
operation
Set the boundaries
Select metrics
Assess impacts at different
stages of the process
Rank stages according
to impacts
Identify the
highest burden
Develop an improvement
strategy
Conduct improvement
Repeat
until all
identified
processes
are
improved
Apply metrics
No
Significant
improvement?
Yes
Go to next burden
Satisfied with
efficiency
improvements?
No
Yes
Go to the next step on
the sustainability
staircase
Figure 5.2
Continuous improvement procedure to increase the efficiency of the current process.
activities characterized by a set of specific inputs and value-added tasks that make up a
procedure for a set of specific outputs” (Baker, 2006). From a practical viewpoint, a process
can be imagined as a black box that transforms inputs into outputs and contains a feedback
loop. A process map contains many individual subprocesses where the output of one subprocess
is the input of another (or others).
For a food-processing facility, a map of the whole system includes as inputs: raw
materials coming from the fields, water, ingredients, packaging material, human resources,