Information Technology Reference
In-Depth Information
frames as well as request retransmissions of lost base layer packets. The stringent la-
tency constraint associated with interactive RoI makes retransmissions of enhance-
ment layer packets difficult. Recall that the base layer can be used to fill in missing
parts while rendering the RoI. The error-concealed parts might appear blurry but the
user experiences low-latency RoI control.
5.3
Protocol Performance
A simulation with 100 peers was carried out by implementing the IRoI P2P protocol
within the NS-2 network simulator. The shape of the cdf of peer uplink capacities
was modeled after the one presented in [74], however, the average of the peer uplink
capacities was set to 2 Mbps, slightly higher than the 1.7 Mbps average reported
in [74]. A single tree was built per slice. The average upper bound of PSNR among
the peers was 41.9 dB. This corresponds to the hypothetical case when each peer
receives all the slices that it needs. The average lower bound of PSNR among the
peers was 30.6 dB assuming that the base layer is successfully received. The lower
bound corresponds to the case when no high-resolution slices are received by the
peers and the RoI is rendered only using the base layer. The average PSNR was
found to be 38.6 dB, indicating that peers receive most of the enhancement layer
slices required to render respective RoIs.
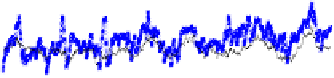
Figure 8 shows the trace of received, required, and missing slices collectively
for the 100 peers. The percentage of missing slices is about 8.3%. The server was
limited to directly serve up to 3 peers per multicast tree. Note that without such a
limit, the server's capacity might be exhausted and the system might not be able to
supply a new slice that no peer currently subscribes. Interestingly, the average num-
ber of slices with non-zero fan-out is only about 172 indicating that all slices are
not streamed all the time. The load on the server was about 13.7 Mbps which is less
than the 14.1 Mbps bit-rate of the multi-resolution representation. Another simula-
tion was carried out in which two multicast trees were built per slice delivering odd
and even frames respectively. The percentage of missing slices remained roughly the
Fig. 8
Trace of received,
required and missing slices
shown collectively for 100
peers watching the
Soccer
sequence. The percentage of
missing slices is about 8.3%.
The server was limited to
directly serve up to 3 peers
per multicast tree. One
multicast tree was built per
slice. Note that due to the
unsubscription delay, peers
can receive more slices than
required.
3500
3000
2500
2000
received
required
missing
1500
1000
500
0
50
100
150
200
Time [sec]