Information Technology Reference
In-Depth Information
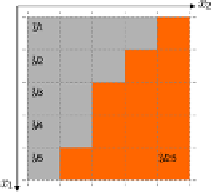
Fig. 3
Steering kernel weights for Lena image without/with noise (white Gaussian noise with
standard deviation
σ = 25) at flat, edge, and texture areas
(a) Input image
(b) The given samples with steering matrices
(c) Upscaled image
Fig. 4
Steering kernel regression for image upscaling: (a)Input image. (b)We compute steer-
ing matrices for each pixel and then estimate. Then, estimate the missing position
z
(
x
) and
denoise the given pixels
y
i
. The red dashed line is a speculative local orientation. (c)Upscaled
image by steering kernel regression.
than the one for
y
1
(i.e.
K
H
1
(
x
1
−
x
13
)). Moreover, Fig. 3 shows visualizations of the
2-D steering kernel function for noise-free Lena image and a low PSNR
1
case (we
added white Gaussian noise with standard deviation 25, the corresponding PSNR
being 20
.
16[dB]). As shown in Fig. 3, the steering kernel weights (which are the
normalized
K
H
i
(
x
i
−
x
) as a function of
x
i
with
x
held fixed) illustrate the relative
size of the actual weights applied to compute the estimate as in (12). We note that
even for the highly noisy case, we can obtain stable estimates of local structure.
At this point, the reader may be curious to know how the above formulation
would work for the case where we are interested not only in denoising, but also
upscaling the images. Fig. 4 illustrates a summary of image upscaling by steering
kernel regression. Similar to the denoising case, we begin with computing steer-
ing (covariance) matrices,
C
i
for all the pixels,
y
i
, from the input image shown in
Fig. 4(a) by (18) as depicted in Fig. 2(a). Once
C
i
's are available, we compute
Peak Signal to Noise Ratio = 10 log
10
Mean Square Error
[dB].
255
2
1