Database Reference
In-Depth Information
2.5
7
Uniform
Triangle
Epanechnikov
Quartic
Triweight
C
osine
Uniform
Triangle
Epanechnikov
Quartic
Triweight
Cosine
6
2
5
1.5
4
3
1
2
0.5
1
0
0
5
10
15
20
25
5
10
15
20
25
Parameter k
Parameter k
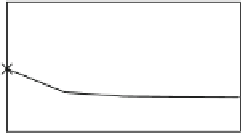
(a) Top-
k
simple typicality queries.
(b) Top-
k
discriminative typicality queries.
16
Uniform
Triangle
Epanechnikov
Quartic
Triweight
Cosine
14
12
10
8
6
4
2
0
5
10
15
20
25
Parameter k
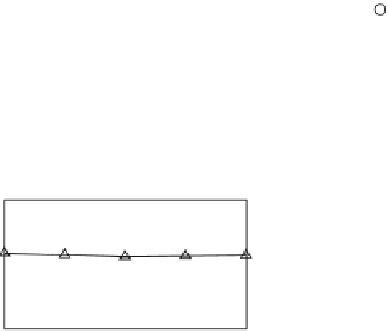
(c) Top-
k
representative typicality queries.
Fig. 4.7
The error rates of using different kernel functions with respect to
k
.
10
14
2h
1.5h
0.5h
2h
1.5h
0.5h
12
8
10
6
8
6
4
4
2
2
0
0
5
10
15
20
25
5
10
15
20
25
Parameter k
Parameter k
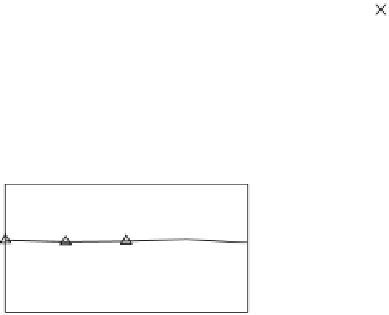
(a) Top-
k
simple typicality queries.
(b) Top-
k
discriminative typicality queries.
16
2h
1.5h
0.5h
14
12
10
8
6
4
2
0
5
10
15
20
25
Parameter k
(c) Top-
k
representative typicality queries.
Fig. 4.8
The error rates of using different bandwidth values with respect to
k
.
by the exact algorithm, and
A
be the set of
k
instances returned by an approximation
algorithm. Then, the error rate
e
is
=
∑
o
∈
A
T
(
o
,
O
)
−
∑
o
∈
A
T
(
o
,
O
)
e
×
100%
(4.16)
∑
o
∈
A
T
(
o
,
O
)