Database Reference
In-Depth Information
140
140
Naive
Det
Sam-Q
Sam
Det-Q
Naive
Det
Sam-Q
Sam
Det-Q
120
120
100
100
80
80
60
60
40
40
20
20
0
0
10
20
30
40
50
0.2
0.4
0.6
0.8
1
Probability threshold
k
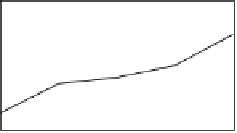
(a) Runtime vs.
k
.
(b) Runtime vs. probability threshold.
50
140
Naive
Det
Sam-Q
Sam
Det-Q
Det-Q
Sam-Q
Quantile computation
120
40
100
30
80
60
20
40
10
20
0
0
10
20
30
40
50
10
20
30
40
50
Variance
Number of instances in a quantile summary
(c) Runtime vs. Variance.
(d) Runtime vs. quantile summary size.
Fig. 6.4
Efficiency.
100
100
95
90
Precision(Sam)
Precision(Det-Q)
Precision(Sam-Q)
Recall(Sam)
Recall(Det-Q)
Recall(Sam)
Precision(Sam)
Precision(Det-Q)
Precision(Sam-Q)
Recall(Sam)
Recall(Det-Q)
Recall(Sam)
90
80
85
70
80
60
75
50
10
20
30
40
50
0.2
0.4
0.6
0.8
k
Probability threshold
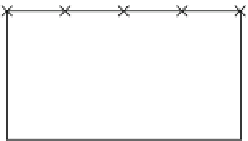
(a) Quality vs.
k
.
(b) Quality vs. probability threshold.
100
100
90
80
Precision(Sam)
Precision(Det-Q)
Precision(Sam-Q)
Recall(Sam)
Recall(Det-Q)
Recall(Sam)
80
60
Precision(Det-Q)
Precision(Sam-Q)
Recall(Det-Q)
Recall(Sam)
70
40
60
20
50
10
20
30
40
50
10
20
30
40
50
Variance
Number of instances in a quantile summary
(c) Quality vs. Variance.
(d) Quality vs. quantile summary size.
Fig. 6.5
Approximation quality.
6.4.3 Efficiency and Approximation Quality
Figure 6.4 shows the runtime of the four algorithms. To show the effectiveness of
the compatible dominant set technique and the pruning techniques discussed in Sec-