Agriculture Reference
In-Depth Information
A
10
μ
m
B
C
D
4000
800
4000
800
4000
Wavenumber/cm
−
1
800
Wavenumber/cm
−
1
Wavenumber/cm
−
1
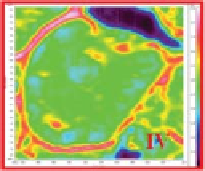
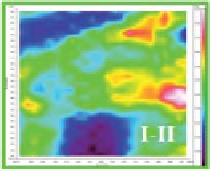
Fig. 12.6
Compare correlation map in the range 1800-1480 cm
-1
on an ovary section from zebrafish
(A) with representative spectra from (B) class I-II, (C) class III and (D) class IV oocytes. (Source: Carnevali
et al.
2009.) For colour detail see Plate 16.
Table 12.1
Rate (%) of GVBD of zebrafish IIIa and IIIb follicles isolated from
control group ovaries incubated in L15 (CTRL) and L15
+
MIH (MIH) (1
μ
g/ml)
and of IIIa and IIIb follicles isolated from probiotic (
Lb. rhamnosus
) group ovaries
incubated in L15 (PROBIO) and L15
+
MIH (PROBIO
+
MIH),
n
=
20. Different
superscript letters indicate statistically significant differences (
P
0.05).
<
CTRL
CTRL
+
MIH
PROBIO
PROBIO
+
MIH
3
±
1
a
20
±
2
b
6
±
1
a
42
±
3
c
IIIa
21
±
3
b
70
±
4
d
25
±
2
b
96
±
4
e
IIIb
Source: Gioacchini
et al
. 2012.


Search WWH ::

Custom Search