Agriculture Reference
In-Depth Information
(A)
100
90
80
70
60
Bacillus
spp.
Enterococcus
spp.
50
40
30
20
10
0
M
D
MD
MD
MD
Control group
2B group
EF group
2B+EF group
(B)
100
90
Bacillus
spp.
Enterococcus
spp.
80
70
60
50
40
30
20
10
0
M
D
MD
MD
MD
Control group
2B group
EF group
2B+EF group
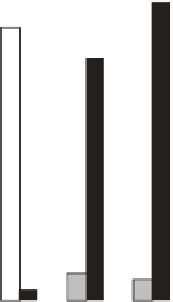
Fig. 8.1
Proportion (%) of
Bacillus
spp. and enterococci from the culturable rainbow trout intestinal
microbiota after 10 weeks feeding on the experimental diets, without (A) and with (B) an oxolinic acid
pre-treatment prior to probiotic feeding. Intestinal regions: M, mucosa; D, digesta. Dietary treatments: 2B,
B. licheniformis
+
B. subtilis
;EF,
E. faecium
;2B
+
EF,
B. licheniformis
+
B. subtilis
+
E. faecium
. (Source:
Adapted from Merrifield
et al
. 2010c and Merrifield
et al
. 2010d.)
maculatus
) fry. Furthermore, the total heterotrophic bacterial levels generally decreased in all
probiotic fed molly, swordtail and southern platyfish groups while levels in the control groups
increased with the trial duration. Motile aeromonad counts increased in the control fed fish
but generally decreased in all species of the probiotic fed fish. The presumptive pseudomonad
levels of all four fish species investigated decreased after 90 days of feeding on the probiotic
diets by an average of ca. log 1.5 CFU g
-1
but only by ca. log 0.5 CFU g
-1
in the control
fed group. The total coliform count remained either stable or significantly lower in all fish


Search WWH ::

Custom Search