Database Reference
In-Depth Information
As you can see, you now have five markers. While our data does not present itself
well in this scenario, it does demonstrate the fact that more than three icons can be
used with the KPIs.
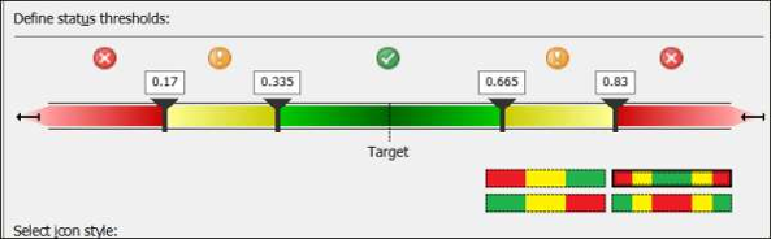
The last scenario uses one of the tricolor options with five segments. Select the
threshold set that is red, yellow, green, yellow, red. This option allows you to set a
KPI where "close to target" is good. This will create four markers, but they actually
still only have three states: good, concerned, and bad.
As you can see from these examples, you are able to create a variety of KPIs that
can be used with your models.
See also
• Look at the next chapter on DAX in order to understand more complex cal-
culations that you can use to create more compelling KPIs.
Search WWH ::

Custom Search