Information Technology Reference
In-Depth Information
After
FROMTOCHART
table is created and parsed transitions in activity streams are
populated to this table, scores are evaluated with respect to support and confidence
thresholds (
supportFTC=0.40
and
confidenceFTC=0.40
). Table 1 shows the initial
and final states of
FROMTOCHART
table.
After scores are evaluated, GA engine reproduces activity sequence starting with
firCon
activity and then calculates fitness score for these activity sequences
according to proposed population size (
populationSize=80
) and maximum number
of iterations (
maxIterationNum=200
) settings.
As shown in Figure 1, initial population is quite diverse early on the process, so
crossover frequently takes large steps early in the search space and fitness scores of
the individuals tend to increase. Afterwards smaller steps are taken when most
individuals are quite similar, i.e. the gap between average and maximum fitness score
boundaries has shrunk. Consequently the fittest (and optimum) activity sequence is
obtained as {
firCon
,
makTic
,
arrSur
,
infCliSur
,
sur
,
intRep
,
repRdy
,
rdyInfCli
,
senTic
,
ticRdy
} with a 0.779 fitness score.
Fig. 1.
Runtime Analysis for Rearrangement Operation.
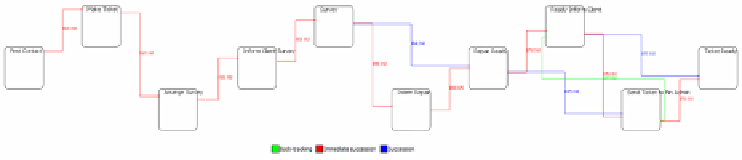
After rearrangement of
FROMTOCHART
table, relations are extracted according to
positive scores remarked at
FROMTOCHART
table. Consequently, dependency/frequency
graph, which visually converts the fittest activity sequence (
genotype
) into the process
model (
phenotype
), is constructed as shown in Figure 2.
Fig. 2.
Extracted Relations in Dependency/Frequency Graph.


Search WWH ::

Custom Search