Information Technology Reference
In-Depth Information
We have used PL-SQL developer Ver. 6.0.3.893.
a
s our Multi-Agent development
tool for developing TA, RA
, LA
and
KCA
. Reader may refer to
http://www.ju.edu.jo/sites/Academic/obein/Lists/Academic%20Conferences/AllItems.a
spx for the pseudo-code of the agents.
.
We have run several experiments where each is
designed to measure a specific functionality as follows:
1. Test-Retest Reliability:
The reliability of the model depends on reliability of the
agents. We have measured the reliability of TA, RA,
KCA
and LA
.
2. Measuring Internal Consistency Reliability for RA
:
We measure internal consis-
tency reliability for RA with regard to a single parameter. Figure 4 shows the val-
ues of internal consistency reliability for 5 trials. The minimum value is 80%.
3. Measuring System Efficiency:
We have run experiments to measure the efficiency
of RA and KCA. We increase the number of cases and experts in the following or-
der (1000, 2000, …, 6000) for the case-base and (45, 90, 135, 180, 225, 270) for
KB. Figure 5 shows the additional execution times RA needed to investigate the
new cases. Figure 6 shows that the performance RA varies in a stable manner when
the number of cases of additional organizations increases. (cf. Figure 7).
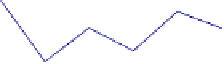
Internal Consistancy Reliability of RA With Regard to Course-Name
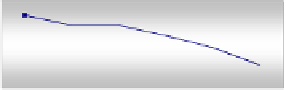
Execution Time of RA among Number of Organization
120
3.24
3.22
100
3.2
80
3.18
3.16
60
3.14
40
3.12
3.1
20
3.08
3.06
0
1
2
3
4
5
6
1
2
3
4
5
M inor Adjustment Trials
Organization Levels
Fig. 4.
Measuring the internal consistency
Fig. 5.
Execution times that RA needs
reliability for RA. to investigate new cases.
Average Mean
To t a l Mea n
Variance betwe en Values of Column (B) and the Average Mean
Variance Comparis on Re garding Ave rage Me an and Total M e an
0.12
0.06
0.1
0.04
0.08
0.02
0.06
0.04
0
0.02
1
2
3
4
5
6
-0.02
0
-0.02
1
2
3
4
5
6
-0.04
-0.04
-0.06
-0.06
-0.08
-0.08
Organization levels
Organization Level
Fig. 6.
Variance values of execution vs
Fig. 7.
Variance to average mean vs
Org. levels & average mean. variance to total mean.
The Averagre Effect of Five Course_Name_Weight Values on RA
Extracte d Re sults
12
10
8
6
4
2
0
25
20
15
10
5
0
Number of Ext ract ed Cases
Fig. 8.
Extracts by RA as course_name increases.


Search WWH ::

Custom Search