Civil Engineering Reference
In-Depth Information
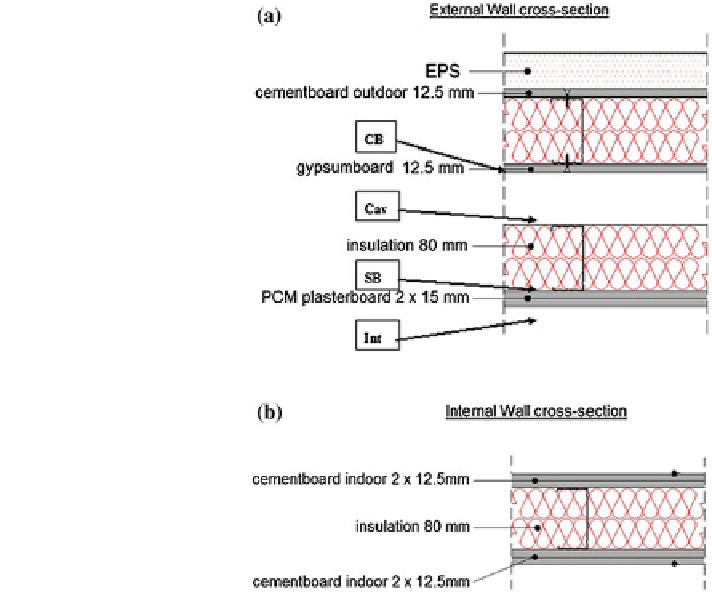
Fig. 5 Cross section of:
a The external wall ('CB',
'Cav', 'SB', 'Int' correspond
to temperature sensors placed
in the LVR east wall). b The
partition wall with cement
boards (Mandilaras et al.
2013
)
Castellón et al. (
2009
) show different results of this experimental set-up. As an
example results from the brick cubicles are shown here. Figure
7
present the
results for free-floating experiments in the brick cubicles, comparing the Refer-
ence, PU and RT27+PU cubicles during a week in August 2008, when the PCM is
working within the phase-change range. As expected, the Reference cubicle
always presents higher temperature oscillations and it is also more sensitive to the
ambient temperature changes than the PU and RT27+PU cubicles.
When comparing the PU and the RT27+PU cubicles, the temperature control
achieved by the use of PCM is observed. The temperature of the RT27+PU cubicle
remains closer to the phase-change range. The RT27+PU cubicle remains cooler
(about 0.4 C) during most part of the week, when the weather is warmer. At the
end of the week (when the weather is cooler), the tendency is reversed, with the
PU cubicle being cooler than the RT27+PU cubicle. This behaviour can be
explained due to the higher thermal mass of the PCM cubicle, which slows down
the general cooling tendency that occurs in the last days of the week. The effect of
the PCM is also visible in the reduction in the daily oscillations of the inside
temperature in the RT27+PU cubicle. It is also observed that the effect of the PCM
is only partially used, as there is no single 24-h period in which full melting and
solidification are achieved.