Civil Engineering Reference
In-Depth Information
Table 4
Particulate matter and main indoor sources
Source
PM size
References
Fossil fuels and biomass combustion
PM
10
,PM
2.5
Pekey et al. (
2010
)
Cleaning: vacuuming and sweeping
PM
10
,PM
2.5
Corsi et al. (
2008
)
Cooking
Oven cooking, toasting, barbecuing
PM
2.5
Abt et al. (
2000
),
Jones et al. (
2000
)
Sautéing
PM
10
Abt et al. (
2000
)
Frying
PM
10
PM
2.5
Abt et al. (
2000
)
Movement of people
PM
10
Abt et al. (
2000
)
Environmental tobacco smoke
PM
2.5
Jones et al. (
2000
)
Construction and demolition activities
PM
10
Latif et al. (
2011
)
smoking were reported. In the EXPOLIS study, personal exposure concentrations
were also measured and reported to be even higher than indoor concentrations
(Kruize et al.
2003
; Lai et al.
2004
).
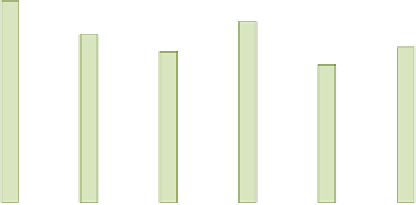
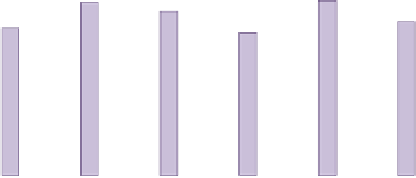
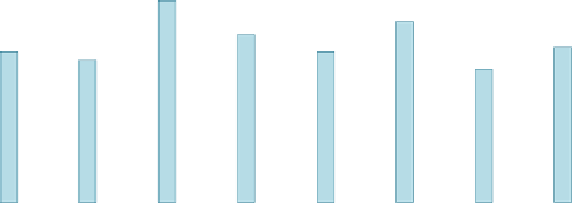
A study performed in the USA reported similar PM
2.5
concentrations in 10
schools (Ligman et al.
1999
). A recent review on indoor pollutants and their
concentration reported that typical concentrations of PM
2.5
in public buildings
ranged between 1 and 150 lg/m
3
, with maximum values of 500 lg/m
3
in build-
ings located in places with high-traffic density or where indoor potential sources
were present, such as tobacco smoking (Kolarik et al.
2012
). Mean values of the
studies summarised in Fig.
4
are in that ranges.
WHO guidelines for IAQ (WHO
2010
) reported that there is no convincing
evidence of a more hazardous nature of PM from indoor sources with respect to the
100
10
1
0
Cities
>100.000 inh.,
USA [1]
Boston,
USA [2]
Athens,
Greece [3]
Basel,
Switzerland [3]
Helsinki,
Finland [3]
Prague,
Czech
Republic [3]
Oxford,
UK [4]
Three urban
centers, USA
[5]
Workplace (building) indoor
Residential indoor
Outdoor
Fig. 4 Indoor and outdoor PM
2.5
mean concentration values from selected studies performed in
the USA and Europe: (1) BASE study: Ligman et al.
1999
, (2) Abt et al.,
2000
, (3) EXPOLIS
study in Athens, Basel, Helsinki and Prague (Kruize et al.,
2003
) (4) EXPOLIS study in Oxford
(Lai et al.
2004
) (5) RIOPA study: Weisel et al.
2005
(5). For the BASE study, geometric mean
values are shown. All outdoor mean values correspond to residences except (1) and (5). Bars
indicate standard error


