Civil Engineering Reference
In-Depth Information
20,000,000
15,000,000
10,000,000
5,000,000
0
-
5,000,000
Baseline scenario
-
10,000,000
Refurbishment scenario
-
15,000,000
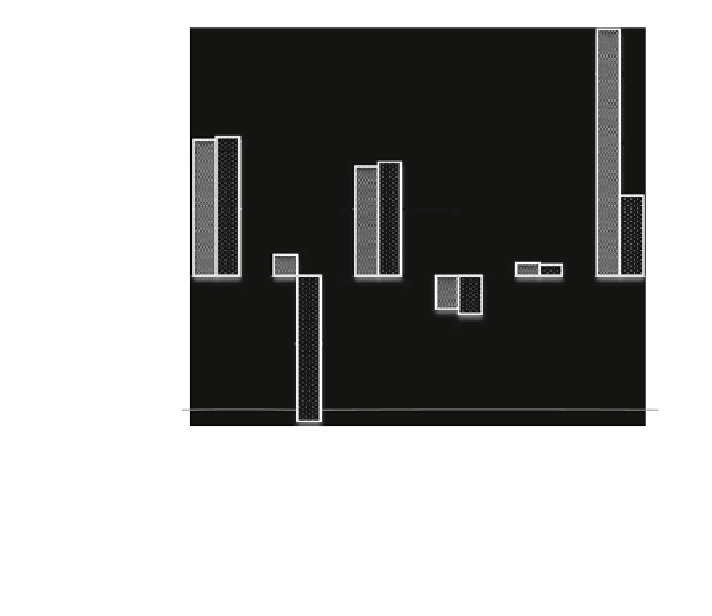
Fig. 7
Contribution of each life cycle phase to the building CED in both scenarios
contributions in all the energy and environmental indicators. With regard to the
CED, it involves primary energy saving of 10,803 GJ, thus reducing the CED of
about 60 % with respect to the Baseline scenario. Such a saving was estimated
taking into account the efficiency of the Italian electricity mix.
The results of the LCIA put into evidence that for each impact category, the
accomplishment
of
the
Refurbishment
scenario
would
involve
a
significant
reduction.
Figures
8
and
9
show the contribution analysis of the different life cycle phases
to the environmental impact indicators in the two scenarios of analysis. As it can
be easily noted, the operation remains the most affecting phase for all environ-
mental indicators. In particular, a GWP reduction of about 70 % of primary energy
consumption is related to the operation phase. ODP goes down to about 28 %,
while AP and EP decrease almost by 100 %. POCP decreases nearly of 40 %.
All of the previous indicators have negative value in the Refurbishment sce-
nario, involving related avoided impacts. To not be neglected is the end-of-life
phase, which involves a range reduction from 20 % (EP) to 50 % (ODP), when
moving from the Baseline to the Refurbishment scenario. It involves a reduction of
25 % in GWP. Worth of note is that in both scenarios, the environmental impacts
induced by the end-of-life have negative values, which implies related avoided