Agriculture Reference
In-Depth Information
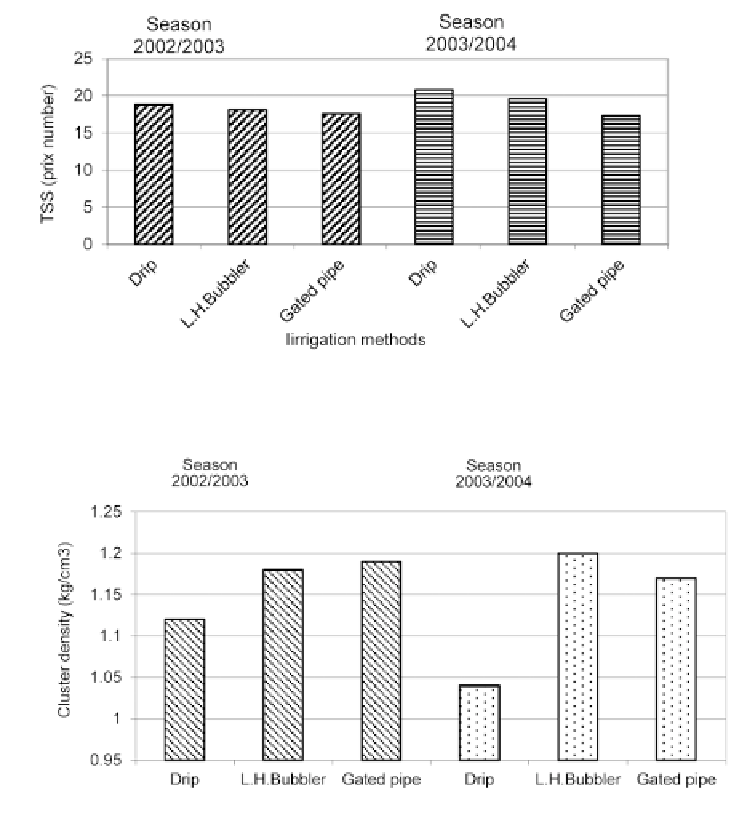
FIGURE 22
Effects of irrigation methods on TSS in grape berry.
FIGURE 23
Effects of irrigation methods on cluster density.
The cluster density (gm/cm
3
) is shown in Fig. 23 for irrigation methods and both
seasons. During 2002-2003, it was 1.12 and lowest in DIS, 1.18 in LHBIS, and 1.19
gm/cm
3
in GPIS. LSD value at P = 0.05 was 0.02, thus indicating signifi cant differ-
ences in cluster density for LHBIS and in any of DIS and GPIS. During 2003-2004,
it was 1.04 and lowest in DIS, 1.2 in LHBIS, and 1.17 gm/cm
3
in GPIS. LSD value at
P = 0.05 was 0.02, thus indicating signifi cant differences in cluster density for LHBIS
and in any of DIS and GPIS. Highest value of cluster density in GPIS may be due to
small volume of berries compared to other irrigation systems. The reductions in cluster
density were −7.14 for DIS and -1.7% in GPIS, respectively. The increase in cluster
density was 1.6% in LHBIS during the second season compared to the fi rst season.


Search WWH ::

Custom Search