Agriculture Reference
In-Depth Information
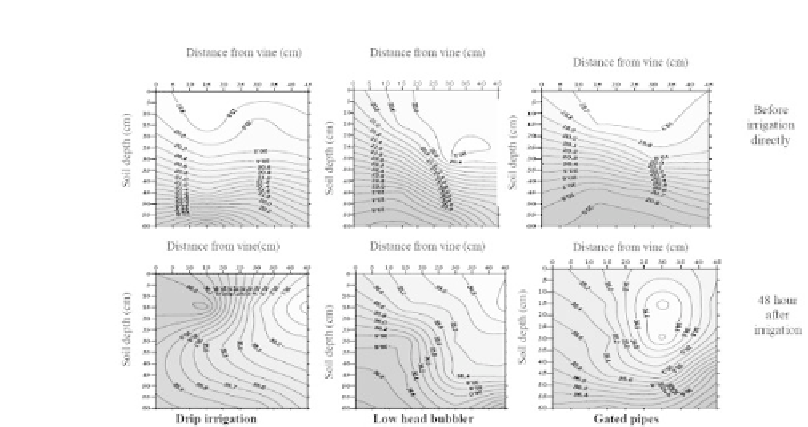
FIGURE 11
Contour maps for soil moisture distribution by weight before and after irrigation
application in each irrigation system at first season 2003-2004.
According to the mean soil moisture content (
w
), irrigation systems can be ar-
ranged in the following ascending orders: [LHBIS=DIS]<GPIS before irrigation, and
GPIS<DIS<LHBIS after irrigation at the beginning of season 2002/2003. Differences
in
w
between any two irrigation systems were signifi cant at the 5% level except that
between LHBIS and DIS before irrigation.
According to
w
, the irrigation systems can be arranged in the following ascend-
ing orders: GPIS<LHBIS<DIS before irrigation and DIS<GPIS<LHBIS after irriga-
tion, both at the end of season 2003/2004. Difference in
w
between GPIS from one
side and both DIS and LHBIS from the other side was signifi cant at the 5% level at the
end of season 2003/2004. It may be due the deterioration of both soil aggregates and
water intake rate into soil and increasing salt accumulation under GPIS in comparison
with DIS and LHBIS.
Maximum and minimum values of moisture content
w
were 27.47% (45-60
cm) and 23.78% (0-15 cm) before irrigation and 47.61% (45-60 cm) and 40.80%
(0-15 cm) in LHBIS and DIS, respectively, after irrigation at the beginning of season
2002/2003. However, at the end of season 2003/2004, the values of
w
were 26.30
(30-45 cm) and 23.88% (0-15 cm) for DIS and LHBIS before irrigation and 45.97
and 42.33% at the same depth (45-60 cm) under GPIS and LHBIS, respectively, after
irrigation.
20.3.1.4 SOIL AGGREGATION
The Table 7 shows the effects of drip irrigation system (DIS), low-head bubbler
irrigation system (LHBIS) and modifi ed surface by using gated pipes irrigation system
(GPIS) on both mean weight diameter (MWD) and aggregation percent (Agg.%).


Search WWH ::

Custom Search