Agriculture Reference
In-Depth Information
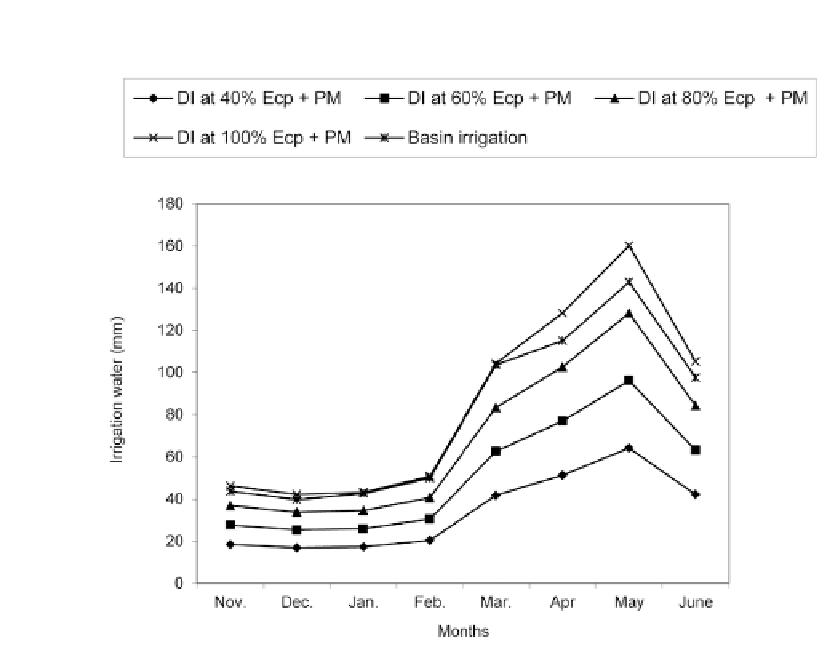
FIGURE 1
Irrigation water applied in different treatments in various months during 2005-08.
18.3.2 SOIL MOISTURE VARIATION
The mean monthly soil moisture variation observed at 0.3 m and 0.6 m depths indi-
cated that drip irrigation at 100% Ecp with plastic mulch showed the highest moisture
content among the treatments, which is very near to field capacity of soil throughout
the irrigation seasons (Table 1). It was observed that the soil moisture fluctuation be-
tween two measurements in a week under basin irrigation was wider than any of the
drip irrigation treatment. It was due to higher rate of evaporation from larger wetted
surface area under basin-irrigated soil coupled with higher transpiration rate of the
plants caused by abundant soil moisture available within the tree rhizosphere just after
irrigation under basin method, as reported by Cohen [3]. Among different drip irriga-
tion treatments, the range of soil water depletion at 0.3 m depth was progressively
increased with increasing irrigation level, indicating the higher rate of evapotrans-
piration (ET) of the plants under higher level of irrigation, even with low volume
irrigation system. However, the soil moisture depletion under different drip irrigation
regimes was almost nil at 0.6 m depth, whereas some incremental was found under
basin method, confirming the percolation of irrigation water from 0-0.3 m soil pro-
file under basin irrigation. This fluctuation was somewhat lower during November to
March than April to June, supporting the higher rate percolation under higher rate of


Search WWH ::

Custom Search