Agriculture Reference
In-Depth Information
was estimated from the minimum air temperature plus or minus a temperature cor-
rection factor. Temperature correction factors, developed for the six NOAA Climate
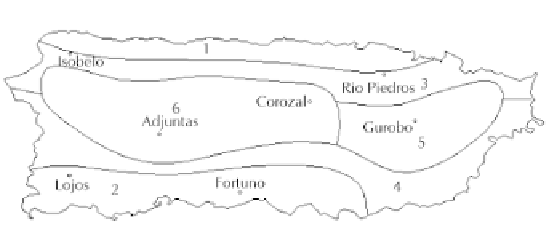
Divisions for Puerto Rico (See Fig. 1), were obtained previously from Harmsen et
al. [20]. Net radiation was estimated from solar radiation (Rs.) by using the method
presented by Allen et al. [10] involving the use of a simple equation for island set-
tings (elevations < 100 m) or by the Hargreaves radiation equation (elevations > 100
m), based on air temperature differences. Pan coeffi cients were estimated from Eq.
(3). Statistical comparisons were made between Kp from average pan evaporation
data collected between 1960 and 1980 and Kp from data collected between 1981
and 2000.
FIGURE 1
MUPR Agricultural Experiment Substation locations and NOAA
climate divisions of Puerto Rico: 1, North Coastal; 2, South Coastal; 3, Northern
Slopes; 4, Southern Slopes; 5, Eastern Interior; and 6, Western Interior.
8.3 RESULTSAND DISCUSSION
Figure 2 shows the monthly average pan evaporation for the seven experi-
mental substations, based on approximately 40 years of pan evaporation
data. Note that pan evaporation was highest for Fortuna and lowest for
Adjuntas for most months of the year. Figures 3, 4 and 5 show the average
monthly pan evaporation with time. Figure 3 shows the sites that had sig-
nificant decreasing pan evaporation with time; Figure 4 shows the sites
that had significant increasing pan evaporation with time; and Fig. 5 shows
the sites that had no significant increase or decrease in pan evaporation
with time. Increases and decreases, as expressed by the linear regression
coefficients, associated with Figs. 3 and 4, were significant at or below the
5% probability level.


Search WWH ::

Custom Search