Agriculture Reference
In-Depth Information
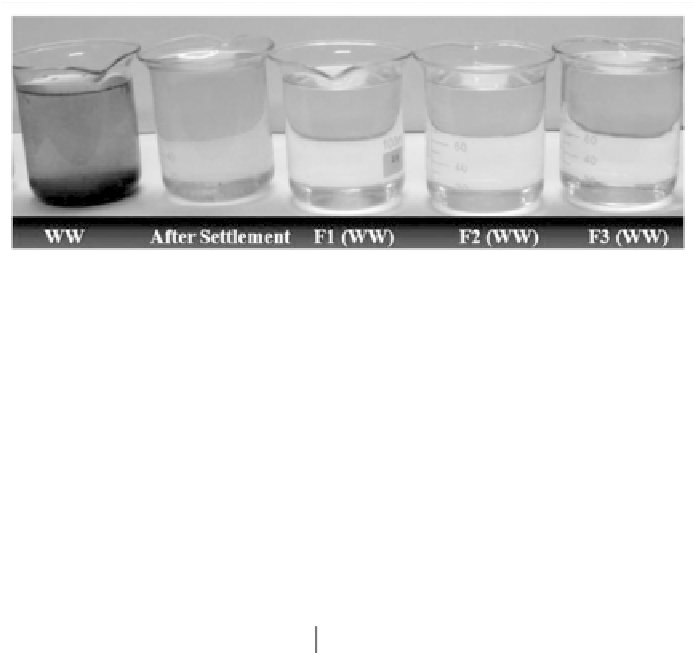
FIGURE 1
Collection of wastewater (WW) before and after filtration.
6.2.4 EVALUATION OF FILTRATION SYSTEM
Performance of filters was evaluated by estimating the Filtration efficiency (E) of the
filters, using Eq. (1).
NN
N
−
()
E
%
=
0
×
100
(1)
0
where: N
0
is a value of specific quality parameter of unfiltered wastewater and N is the
value of the same parameter after filtration.
6.2.5
EVALUATION OF PARAMETERS FOR EMITTER PERFORMANCE
6.2.5.1
UNIFORMITY COEFFICIENT (UC)
⎡
1
n
⎤
∑
qq
−
⎢
⎥
i
n
⎢
⎥
UC
=
100 1
−
i
=
1
(2)
q
⎢
⎥
⎢
⎥
⎣
⎦
where, q
i
= the measured discharge of emitter i (lh
-1
)
;
q = the mean discharge at drip
lateral (lh
-1
)
;
and n = the total number of emitters evaluated.
6.2.5.2
EMITTER FLOW RATE (% OF INITIAL, R)
q
R
=
100
q
ini
(3)
where: q = the mean emitter discharges of each lateral (lh
-1
); and q
ini
= corresponding
mean discharge of new emitters at the same operating pressure of 98.06 kPa (lh
-1
).
6.2.6 STATISTICAL ANALYSIS
Statistical analysis was carried out using the GLM procedure of the SAS statistical
package (SAS Institute, Cary, NC, USA). The model used for analysis of variance
(ANOVA) included water from different filters and placement of lateral as fixed effect
and interaction between filtered water and emitter placement depth. The ANOVA was


Search WWH ::

Custom Search