Environmental Engineering Reference
In-Depth Information
snow- and glacier-driven river discharge regimes in direct competition with wa-
ter abstraction by hydroelectric dams. These Mediterranean mountain regions are
therefore particularly vulnerable in terms of providing water resources.
According to Ludwig
et al.
(2009), there was a sharp decrease in precipitation
and average freshwater flux to the Mediterranean Sea over the 40 years from 1960
to 2000. Although data are patchy, precipitation decreased by about 11% both in
the eastern and western Mediterranean Basin. This is equivalent to a total estimated
decrease in precipitation of 62 mm between 1960 and 2000. Temperature increased
markedly, with the biggest increase of 1.3
◦
C being observed in the northwestern
Basin. Higher temperatures are likely to increase evapotranspiration and therefore
decrease discharge. In the Gulf of Lions, water discharge decreased mainly as a
result of temperature-related reduction of basin internal storage in snow, soils and
groundwater reservoirs. The estimated freshwater discharge into the Mediterranean
decreased to a serious extent, by 15-22%, between 1960 and 2000, which is equiva-
lent to a decrease of 80-100 km
3
/year (the combined annual discharge of the Rhone
and Po; see Figure 5.8). For the Balkans, there have also been dramatic discharge
reductions, for example a 30% decrease in the Drin between 1965 and 1984, and be-
tween 1960 and 2000 a 57% reduction for the Axios, with a catchment of more than
20 000 km
2
(Skoulikidis, 2009). In the eastern as well as the western Mediterranean
Basin, the gap between increasing temperatures and decreasing precipitation has
been widening over the last 40 years (Figure 5.9). Generally, this will result in more
droughts. Considering present trends in global warming and decreases in snowfall,
the security of the late spring/early summer discharge may be seriously threatened
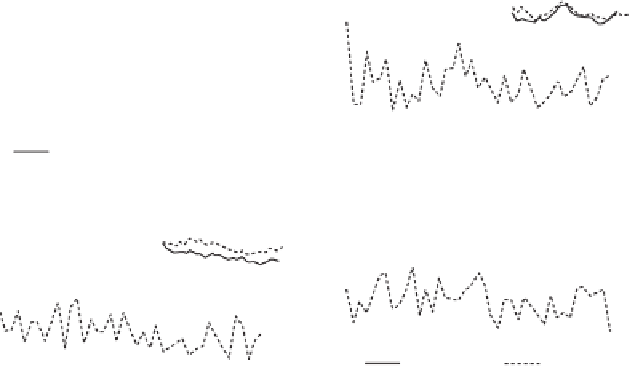
5 year running mean
5 year running mean
1400
Rhône
Po
1200
1000
800
600
400
200
0
Q-observed
Q-Pike
Q-observed
Q-Pike
5 year running mean
5 year running mean
700
600
500
400
300
200
100
0
Ebro
Danube
Q-observed
Q-Pike
1960
1970
1980
1990
2000
1960
1970
1980
1990
2000
Figure 5.8
Comparison of observed and predicted (Q-pike) run-off depths for the Rhone, Ebro,
Po and Danube. Reproduced from Ludwig
et al.
(2009), with permission