Agriculture Reference
In-Depth Information
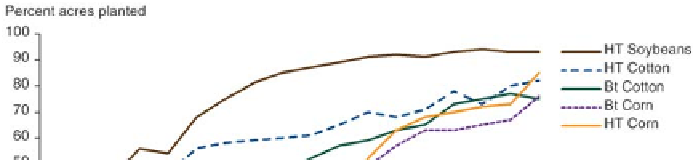
corn acres in 2000 to 26 percent in 2005 and 85 percent in 2013. Insect
infestations tend to be more localized than weed infestations (figure 6).
Farmers planted Bt cotton (to control insects such as tobacco budworm, cotton
bollworm, and pink bollworm) on 35 percent of the cotton acres in 2000, 52
percent in 2005, and 75 percent in 2013. Bt corn—commercially introduced to
control the European corn borer in 1996, the corn rootworm in 2003, and the
corn earworm in 2010—was planted on 19 percent of corn acres in 2000, 35
percent in 2005, and 76 percent in 2013.
Other GE crops commercially grown in the United States are HT canola,
HT sugarbeets, HT alfalfa, virus-resistant papaya, and virus-resistant squash.
10
In addition, other traits are being developed and tested, including cold/drought
resistance and enhanced protein, oil, or vitamin content (see table 2).
11
Based on the Agricultural Resource Management Survey (see box,
“ARMS Data”),
12
farmers indicate that they adopted GE corn, cotton, and
soybeans primarily to increase yields (figure 7). Other popular reasons for
adopting GE crops were to save management time, to facilitate other
production practices (such as crop rotation and conservation tillage), and to
reduce pesticide costs.
Bt crops have insect resistant traits; HT crops have herbicide tolerance traits.
Data for each crop category include varieties with both Bt and HT (stacked) traits.
Source: U.S. Department of Agriculture (USDA), Economic Research Service (ERS).
2013.
Adoption of Genetically Engineered Crops in the U.S.
data product.
Figure 5. Adoption of genetically engineered crops in the United States.