Information Technology Reference
In-Depth Information
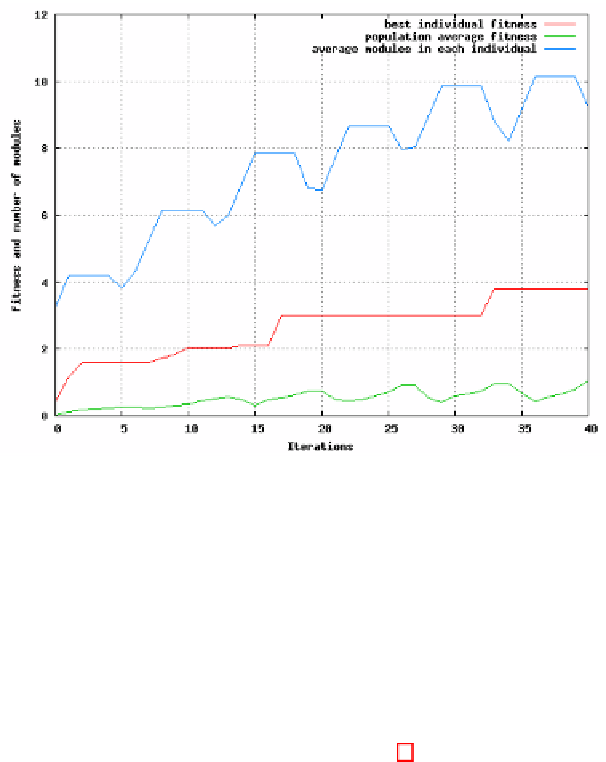
Fig. 3.
Graph of a typical evolution
The evolution starts with a random population of 40 individuals and a maxi-
mum of three modules each, being 16 the maximum allowed. In this experiment,
we have applied two growth phases (add node operator), two morphological
mutations (shake modules operator), one control mutation (shake control op-
erator) and two prune phases (delete nodes operator) each cycle. The growth,
morphological and control phase generate three robot variations in each run.
The remaining steps of the constructive evolutionary strategy are exactly as
described in section 3. The algorithm was run for 10000 evaluations.
A typical evolution result is presented in Fig. 3. This graph shows the best
robot fitness in red and the average fitness of the population in green. In addition,
the average number of modules per robot is displayed in blue. The distinct phases
of the constructive algorithm induce a cyclical pattern in the evolution as shown
in the figure. The growth phase adds new modules to the robots in the population
during the initial iterations. Consequently, the number of modules per robot is
increased and the population average fitness is reduced because the robot is not
adapted to the new module. This effect can be observed in Fig. 3 if one looks at
the areas where the average number of modules line goes up, when the number
of modules increase. In these zones, the average fitness decreases. Then, the
morphological and control mutation phases slowly raise the average fitness and
maintain the number of modules per robot. It can be observed looking at the flat
zones in the average number of modules line. Finally, the pruning phase quickly
raises the fitness of the population as the robots eliminate useless modules. This
effect can be observed in the drop zones of the average number of modules line.
The algorithm uses elitism, and that is the reason why the best individual fitness
graph never oscillates.
Search WWH ::

Custom Search