Information Technology Reference
In-Depth Information
5 Simulation Results
In the simulations, we have conducted several experiments designed to analyze
and evaluate the system performance index, we have considered some variants
such as: the multi-robot system size, regions number and tasks number by re-
gion. The tasks can be constant or can be and time-dependent variable. Stimuli
associated with each task can vary considerably from one task to another de-
pending on the nature of tasks, task demand and by number of robots that are
executing the task. Each task is associated with the demand expressed in the
form of a stimulus, when a robot performs a task tends to reduce the intensity
of associated stimulus, and as a result, modifies the intensity of the stimuli for
tasks that is not running.
Each robot
{
r
}
has a set response thresholds
θ
r
=
{
θ
1
,θ
2
, ..., θ
T
}
. Each thresh-
old
θ
r,t
that the robot is capable
of. The initial values of the threshold are randomized to ensure that their roles
are not predetermined; the performance of a given task induces a decrease in
threshold of the robots:
corresponds to a task type
t
j
=
{
t
1
,t
2
, ..., t
J
}
θ
new
r,t
=
θ
old
r,t
−
σ
(2)
And conversely, the not performance of a given task induces:
θ
new
r,t
=
θ
old
r,t
+
σ
(3)
where
σ>
0.
The distribution of robots in regions is done by Equation 1, obtaining a vector
of probabilities of each robot for each region, can be represented as follows:
P
(
H
|
R
=
r
i
)=[
P
(
h
1
|
R
=
r
1
)
, ..., P
(
h
N
|
R
=
r
1
)]
(4)
where
P
(
H
|
R
=
r
i
)
∈
[0
,
1],
N
is the maximum region number,
i
=1
,
2
, ..., K
robots.
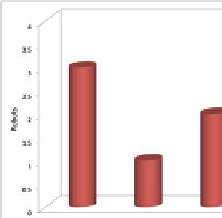
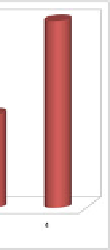
5.1 Distribution of Robots in Regions
Fig. 2 shows the distribution of 10 robots in 4 regions. In Fig. 3 are shown the
results obtained in relation with the stimuli, thresholds and probabilities for 2
Fig. 2.
Distribution of 10 robots in 4 regions

Search WWH ::

Custom Search