Information Technology Reference
In-Depth Information
(a)
(b)
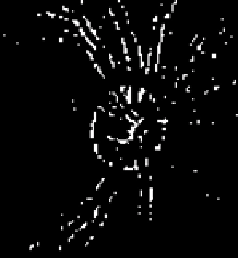
Fig. 4. Examples of sets of IPs and papillary genetic ellipses obtained: (a) Laplacian
pyramid level-2; (b) Laplacian pyramid level-1. Genetic ellipses (solid lines), elliptical
crowns (dashed lines)
within a concentric elliptical crown that contains the genetic ellipse. Figure 4
shows two solution ellipses adapted to the set of IPs obtained in the two levels
of Laplacian pyramid: level 2 (Fig. 4a) and level 1 (Fig. 4b).
The table 1 summarizes the domain of definition of each gene used in the
executions of GA-1 and GA-2. These values are obtained from [1], but they are
transformed taking in count the image resolution in the pyramid levels 1 and 2.
Finally, the table 2 summarizes the configuration values of each of the two AGs
used in our approach.
Tabl e 1 . Definition domain (expressed in pixels) for each of the genes (variables) of a
chromosome (genetic ellipse)
GA-2
GA-1
Image Size
65x65
129x129
[
x
min
,x
max
]
[15, 50]
[30, 100]
[
y
min
,y
max
]
[15, 50]
[30, 100]
[
a
min
,a
max
]
[8, 15]
[16, 30]
[
b
min
,b
max
]
[8, 15]
[16, 30]
[
ω
min
,ω
max
]
[15°, 175°]
[15°, 175°]
3 Experiments and Results
To measure the performance of our algorithm, we used DRIONS database [13].
In order to do the result of the evaluation quantitatively reproducible, we mea-
sured the mean discrepancy between the points of the contour obtained with the
segmentation method and a gold standard defined from a contour that was the
result of averaging two contours, each of them traced by an expert. Here we use


Search WWH ::

Custom Search