Information Technology Reference
In-Depth Information
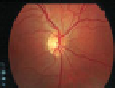
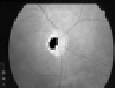
(a)
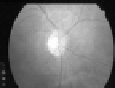
(b)
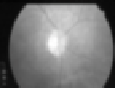
(c)
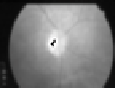
(d)
(e)
(f)
(g)
(h)
(i)
Fig. 3. An example that shows the different phases of the image subwindow extraction
task: (a) original image at level 0; (b-d) image red channel Gaussian pyramid, showing
levels 1, 2 and 3, respectively; (e) region of the brightest points (RBP) in level 3,
represented by the centered black pixels; (f-h) inverse Gaussian pyramid (containing
RBP): levels 2, 1 and 0, respectively; (i) final image subwindow centered at level-0
RMP centroid
more IPs that the ellipse contains, the more likely this ellipse will approach the
real contour of the papilla. The results obtained in [1] support the validity of the
two hypotheses.
Specifically, we use a two-phase GA: GA-2+GA-1 (see figure 1). GA-2 is
applied to level-2 of pyramid to find an ellipse containing the maximum number
of IPs in an offset of its perimeter. The result is a first approximation to our
problem, i.e., a set of papillary contours in that level. Now, we expand the best
contours obtained previously from level-2 to level-1 for using them as part of the
GA-1 initial population. The other subset of individuals, needed to complete the
GA-1 initial population, is obtained randomly. Then GA-1 is applied to IPs of
level-1 with the same goal than GA-2. Finally, in order to produce the solution,
the best papillary contour obtained by GA-1 is expanded from level-1 to image
subwindow original level (level-0). At this point, it is important to say that we
do not work in the Laplacian pyramid level-0 because the IPs obtained in this
level contain a lot of noise.
The phenotypic space, solution space of the original problem, consists of the
elliptic crown space defined from the infinite ellipses that can be traced in the
image. To code this type of solutions, the phenotypic space is transformed into
a genotypic space consisting of real vectors of five variables
[
x, y, a, b, ω
]
.Thus,
(
the magnitudes of its major and
minor semi-axis respectively and
ω
the angle that its major axis forms with
the x-axis. The fitness function is defined by counting the IPs number confined
x, y
)
represents the centre of this ellipse,
(
a, b
)


Search WWH ::

Custom Search