Information Technology Reference
In-Depth Information
Table 1.
Analysis of
LZHP
,
ApEnHP
and
ApEnWP
correlation with age
Signal
β
1
r p ρ ps
LZHP sfa4 −
0
.
644
·
10
−
3
0
.
492 0
.
182
·
10
−
3
−
0
.
465 0
.
454
·
10
−
3
LZHP PPS sfa4 −
0
.
203
·
10
−
3
0
.
278 0.044
−
0
.
259 0
.
062
LZHP sflp −
0
.
738
·
10
−
3
0
.
469 0
.
399
·
10
−
3
−
0
.
448 0
.
770
·
10
−
3
LZHP PPS sflp −
0
.
269
·
10
−
3
0
.
290 0.035
−
0
.
261 0
.
059
ApEnHP sfa4 −
1
.
016
·
10
−
3
0
.
492 0
.
182
·
10
−
3
−
0
.
473 0
.
354
·
10
−
3
ApEnHP PPS sfa4 −
0
.
514
·
10
−
3
0
.
344 0.012
−
0
.
317 0
.
021
ApEnHP sflp −
0
.
795
·
10
−
3
0
.
431 1
.
270
·
10
−
3
−
0
.
381 4
.
849
·
10
−
3
ApEnHP PPS sflp −
0
.
546
·
10
−
3
0
.
369 0.007
−
0
.
355 0
.
009
ApEnWP sfa4 −
0
.
288
·
10
−
3
0
.
389 3
.
982
·
10
−
3
−
0
.
440 0
.
980
·
10
−
3
ApEnWP PPS sfa4 −
0
.
054
·
10
−
3
0
.
363 0.008
−
0
.
368 0
.
007
ApEnWP sflp −
0
.
315
·
10
−
3
0
.
417 1
.
880
·
10
−
3
−
0
.
463 0
.
488
·
10
−
3
ApEnWP PPS sflp −
0
.
045
·
10
−
3
0
.
296
0.032
−
0
.
301
0
.
029
0.3
0.11
0.28
0.1
0.26
0.09
0.24
0.08
0.22
0.07
0.2
0.06
0.18
0.05
0.16
0.04
0.14
0.03
0.02
0.12
60
70
10
20
30
40
50
60
70
10
20
30
40
50
Age (Yrs)
Age (Yrs)
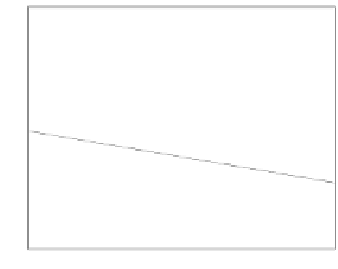
(b)
ApEnWP
vs age (
sflp
)
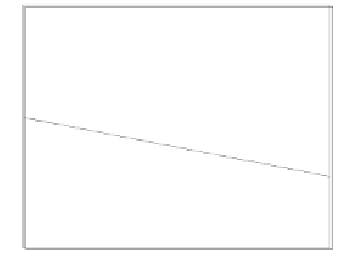
(a)
LZHP γ
vs age (
sfa4
)
Fig. 2.
Correlation of some phase complexity measures with age
identical parameters for linear regression, although
ApEnHP
has a slightly better
Spearman's rank correlation. However,
LZHP
exhibits the smallest sensitivity
to the signal bandwidth and the largest differences with surrogates. In fact,
ApEnHP
fails the surrogate test for the
sflp
signal, but not for
sfa4
.Conversely,
ApEnWP
fails the surrogate test for the
sfa4
signal, but not for
sflp
. In summary,
LZHP
might be considered a more robust index.
Our analysis suggests that the signal bandwidth is somewhat critical for the
ApEn
based measures. PPS surrogates seem to be too similar to the original
signal, perhaps because they retain some feature of the periodic orbit in the
phase space that
ApEn
statistic can not discriminate solely based on linear
regression. Further studies are needed to assess the dependence on bandwidth
and different kinds of cyclic surrogates should be tested. It is worth to note that
the mean value of the
LZHP
index for
sfa4
signals is
γ
=0
.
196
0
.
031, while for
a pure 1
c/d
sinusoidal signal it is
γ
=0
.
050. This seems to reveal a relatively
high phase complexity level in healthy circadian temperature rhythms.
±


Search WWH ::

Custom Search