Information Technology Reference
In-Depth Information
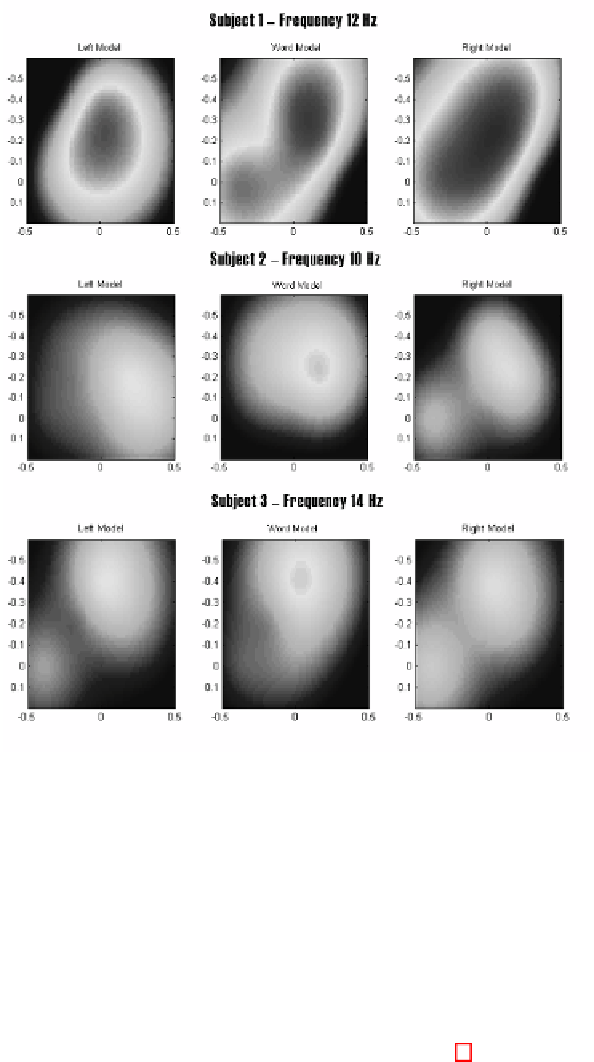
Fig. 3.
Example of EEG maps obtained for each subject with the most significant
frequencies used
3.2 Classifier
After deciding which are the most significant frequencies on each user, the EEG
maps can be differentiated using an image comparison. A numerical index has
been calculated to show the similarity between images. This value is obtained
as the mean of the difference of all the points of the comparing images. As the
original images that are subtracted have values between 0 and 1, the results
obtained are the percentage of difference.
A classifier has been designed as it is shown in Figure 3 and is divided in two
phases:
- Models Obtention (Figure 4):
from the 4 sessions registered oine for
each subject, 3 of them are selected to obtain the EEG maps models for
each mental task (left, right and word). A processing window of 5 seconds is
Search WWH ::

Custom Search