Information Technology Reference
In-Depth Information
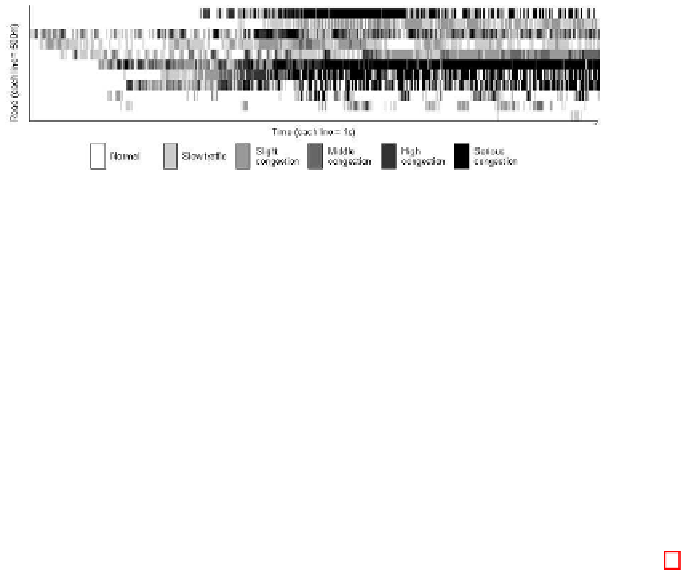
Fig. 6.
Trac density along time in test 1
between them, injecting trac into some common stretches that will be the focus
of our tests.
Among the parameters to be settled, let us remark the congestion level nec-
essary for setting warning levels according to the severity of the situation. It
has been also considered that not all the drivers are subscribed to the warning
system, and not all of those who are subscribed will follow the system rec-
ommendations. This factor was introduced in the simulation by adjusting the
percentage of changes in the routes and driving mode behaviors. Its influence
must be analyzed in order to understand how this may affect the success of the
system deployment.
For the same scenario, trac simulations have been executed with the pro-
posed system off and on (with different configurations and warning sets). Fig. 6
shows trac density along a road time, presenting the trac density in stretches
of 500 m with different gray levels. Road direction is bottom-up in the image.
Therefore, the motion of a vehicle on the road could be understood as a diagonal
movement along the graph, from the bottom-left corner till the upper-right one.
In Fig. 6 for test 1 it can be seen how congestion grows in both severity, taking
into account the number of vehicles per kilometer and lane, and space, being the
jam propagated to previous segments of the road. In this example, an adjacent
road joins the road shown in this image causing “sudden” jams. Congestions
become more and more serious since the vehicles of both roads meet in the same
stretch. These data are used as inputs to the engine of congestion detection.
For test 1, a predefined tuned congestion level is surpassed and the system
starts the process of congestion amelioration by means of messages to vehi-
cles and road panels. For slow trac, only vehicles registered in the service are
warned. For more severe situations, the system generates notifications for all the
vehicles involved and those driving previous stretches of the road that lead to
the stretch with congestion. Vehicles that can take an alternative route could
avoid the congestion and those that must pass (or decide to) pass through the
congested stretch can adapt their speeds.
The consequences of launching services for congestion mitigation are shown
in Fig. 7 in test 2. It can be seen how the severity of the congestion decreases,
although congestion does not disappear completely. This is due to the limited
number of alternative routes and the assumption that some drivers dismiss the
warnings.

Search WWH ::

Custom Search