Information Technology Reference
In-Depth Information
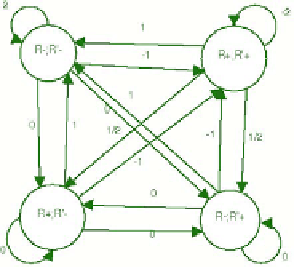
Fig. 6.
Four state diagram
Fig. 7.
Results four states
Fig. 8.
Four states convergence curve
In the results we observe the differences between nine states and this other
simple approximation and see that it does not affect to the quality of the exper-
iments results. In the figure 7we show the last episode for the same experiment
that we run with nine states approach. We can see that the result is similar than
the result of the figure 4 so we can say that we do not lose any quality in the
solution. However, the number of episodes that we need to converge is reduced
to only 50 episodes as we can see in the figure 8.


Search WWH ::

Custom Search