Information Technology Reference
In-Depth Information
0.9
1e-05
0.9
1e-05
(a)
Map 1
(b)
Map 2
Fig. 5.
Improvement of our method over the random behavior
The same experiments are performed over the map as showed in Fig. 3 (b)
(referenced as
). This map, with a high connectivity in all nodes, presents
a great number of routes on which to choose as best candidate. Fig. 6 shows
the results of the inspection task in the
Map 2
by the random and the selective
behaviors with a high and a low probability of communication failure (
Map2
0
.
9
and
0
.
0001
respectively).
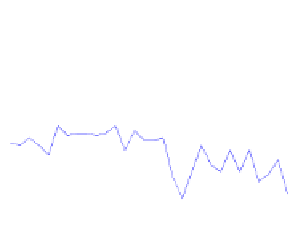
Mean steps per team with a probability of communication failure of 0.9
Random behavior
Selective behavior
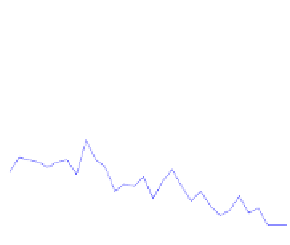
Mean steps per team with a probability of communication failure of 1e-05
Random behavior
Selective behavior
700
700
600
600
500
500
400
400
300
300
200
200
100
100
0
0
1 2 3 4 5 6 7 8 9 10 11 12 13 14 15 16 17 18 19 20 21 22 23 24 25 26 27 28 29 30
1 2 3 4 5 6 7 8 9 10 11 12 13 14 15 16 17 18 19 20 21 22 23 24 25 26 27 28 29 30
Fig. 6.
Experiments results relative to mean steps
In this case, the improvement over the random behavior is not so good as in
previous experiments. Now, as is showed in Fig. 5 (b), it ranges 40% to 20% (10%
for a high number of agents per team and a high probability of communication
failure).
If we compare our method in both maps (Fig. 7), it can be appreciate as
the edge increase does not significantly affect the steps necessary for complete
inspection of the environment, i.e. our method is quite robust against the map
topology.


Search WWH ::

Custom Search