Information Technology Reference
In-Depth Information
Global parameters through evolution
1.00
0.75
0.50
0.25
0.00
0
25
50
75
100
125
150
Time steps (
×
10
3
)
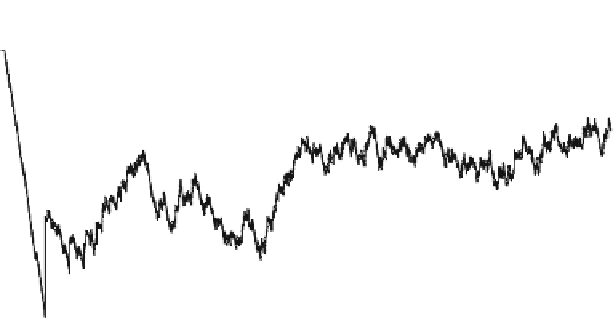
Fig. 3.
Evolution of the main parameters that describe the example
these trials. In Fig. 3 we have represented the evolution of the following param-
eters: average energy level of the robots (thick line), average task completion
time (dotted line), average lifetime (thin line) and average mating selection time
(dashed line). The first result that must be pointed out is that the average en-
ergy level increases and becomes stable, meaning that the robot team learns to
place the assembled blocks in the collection area properly. Furthermore, the av-
erage time for task completion clearly decreases and also becomes stable, which
is consistent with the energy evolution.
Regarding the other two lines in Fig. 3, and taking into account that the
maximum lifetime of a robot is 50000, until time step 15000 the population does
not perform the task properly, and most of the individuals die because they run
out of energy, this is, they do not reach their maximum lifetime. From this time
step forward, the population improves and the robots tend to last until they
reach their maximum allowed age (50000). For this reason the graph shows an
oscillating behaviour in the population with a 50000 time steps period.
Fig. 4(a) and 4(b) display a representation of the values of the
useful speeds
,
s
isolated
and
s
assembled
, for each robot during evolution. These values are ob-
tained using the following formulas and represent a combination of the speed and
grasping capability of the robots when carrying assembled or activated blocks:
s
assembled
=
s
assembled
·
sign
[2
·
h
assembled
−
1]
s
isolated
=
s
isolated
·
sign
[
h
isolated
−
0
.
5]
These useful speeds are used to reduce the complexity of the representation of
the genetic code of the individuals. Negative values indicate individuals not able


Search WWH ::

Custom Search