Information Technology Reference
In-Depth Information
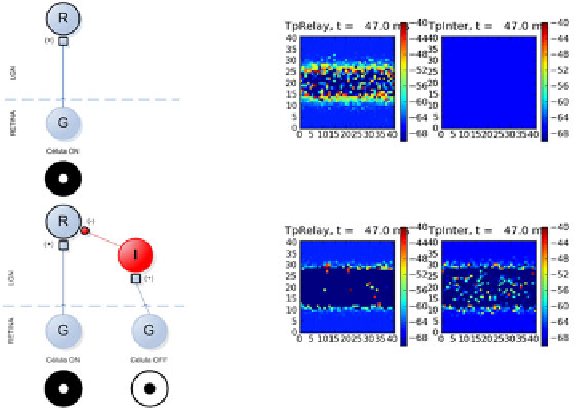
Fig. 3.
ON Channel processing and OFF channel inhibition. The figure shows both
circuit, with and without inhibition and the difference of activity in the ON relay cell
when we have enable and disable the inhibition pathway.
-
ON Channel enabled and OFF channel disabled. The simulation shows that
at time t = 47 ms the activity of the LGN cell population is centered mainly
on the edges of the horizontal bar. Although the ON channel is detecting
edges due to the structure of the receptive field DoG, we see that a significant
activity remains at its center (see simulation Figure 3).
-
ON and OFF Channels enabled. If we present the same stimulus in both
channels ON and OFF and we enable the inhibitory pathway coming from
the OFF channel, the stimulus edges are detected more precisely (Figure 3).
Moreover, the time required to detect the edges is significantly reduced (not
shown) when compared with the previous simulation.
It can be concluded that the OFF channel implements a gain control function
over the retinal input reaching the ON channel relay cells with the goal of high-
lighting the contrast of intensity found at the stimulus edges.
4.2 Perception of Stimulus Size Depending on Stimulus Contrast
In the next experiment we have generated different stimulus with varying de-
gree of contrast between the stimulus and background (Figure 4). The results
obtained from our simulations show:
-
The perceived size of the stimulus in ON channel relay neurons increases as
the contrast of the stimulus is increased (Figure 4).
Search WWH ::

Custom Search