Database Reference
In-Depth Information
Chapter 3
Analysis of Reproducible Problems
The most efficient way to approach a reproducible problem is to take advantage of one of the available tracing and
profiling features to perform a controlled measurement while an application is experiencing the problem. At first, the
aim is to categorize the problem into three major classes:
•
The database engine spends most of the time executing SQL statements.
•
The database engine spends most of the time executing PL/SQL code.
•
The database engine is (almost) idle. In other words, the bottleneck is located outside the
database tier.
To categorize the problem, you start the analysis by tracing the database calls. If the analysis points to the SQL
statements, then the trace files used in the first place to categorize the problem already contain all the necessary
information for a detailed analysis. If the PL/SQL code is questioned, you should perform a profiling analysis of the
PL/SQL code. Otherwise, the problem isn't due to the database tier, and, therefore, the analysis should continue with
a profiling of the application code
not
run by the database engine.
The aim of this chapter isn't only to describe the tracing and profiling capabilities provided by Oracle Database,
but also to show examples of tools you can use to support your analysis. Ultimately, the purpose here is to show you
how such tools can enhance your ability to quickly and, therefore, efficiently identify performance problems.
Tracing Database Calls
When the bottleneck is situated in the database tier, it's necessary to take a closer look at the interactions between
the application and the database engine. Oracle Database is a highly instrumented piece of software, and thanks to a
feature called
SQL trace
, it can provide detailed trace files containing not only a list of executed SQL statements, but
also in-depth performance figures about their processing.
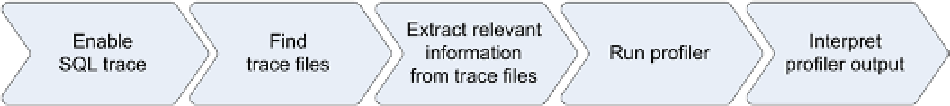
Figure
3-1
shows the essential phases involved in the tracing of database calls. The next sections, following an
explanation of what SQL trace is, discuss each of these phases in detail.
Figure 3-1.
Essential phases involved in the tracing of database calls