Database Reference
In-Depth Information
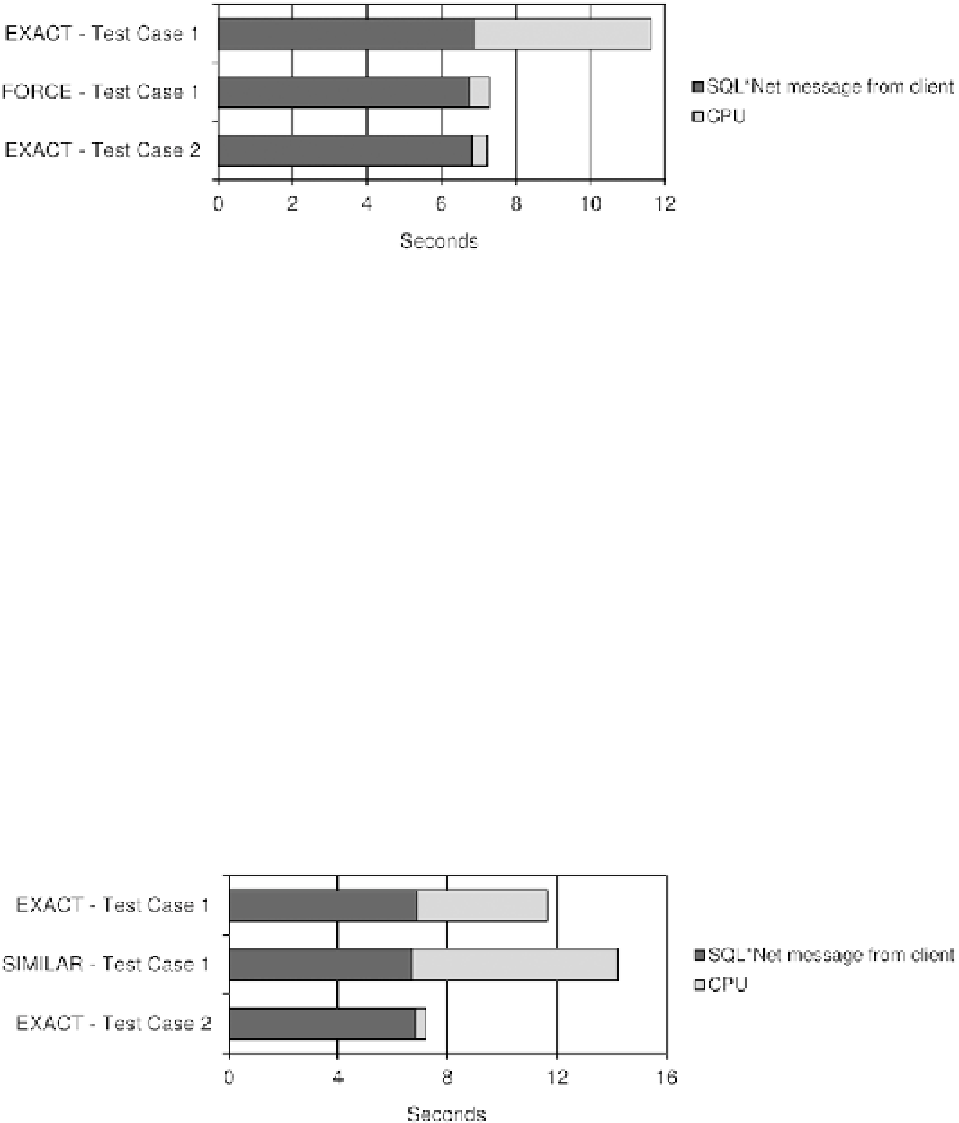
Let's take a look at the results with the value
force
. As shown in Figure
12-11
, the database-side resource usage
profile in test case 1 (with the value
force
) is similar to the one in test case 2 with
exact
. Actually, both executed a
single hard parse and 9,999 soft parses. As a result, thanks to cursor sharing, the parse time was greatly reduced. With
the value
force
, there is just a slight increase in the CPU utilization. Since the database engine has to perform more
work in order to replace literals with bind variables, this is to be expected.
Figure 12-11.
Comparison of the database-side resource usage profile with cursor sharing set to
force
.
(Components that account for less than 1% of the response time aren't displayed because they wouldn't be visible.)
If adaptive cursor sharing isn't considered, the problem related to the value
force
is that a single child cursor can
be used for all SQL statements sharing the same text after the replacement of the literals. Consequently, the literals
(that, among other things, are essential for taking advantage of histograms) are peeked only during the generation of
the execution plan related to the first submitted SQL statement. Naturally, this could lead to suboptimal execution
plans because literals used in subsequent SQL statements might require different execution plans. To avoid this
problem, the value
similar
is available. In fact, with
similar
, before reusing a cursor that is already available, the SQL
engine checks whether a histogram exists for one of the replaced literals. If it doesn't exist, any available child cursor
that has a compatible execution environment can be used. If it does exist, only a child cursor that has been created
with the very same literal value can be used. As a result, with
similar
, instead of having a single parent cursor for
every literal value, you end up having a single child cursor for every literal value (which uses less memory).
As shown in Figure
12-12
, the database-side resource usage profile in test case 1 with the value
similar
is even
worse than in test case 1 with
exact
. The problem is not only that 10,000 hard parses were executed, but also that
the CPU utilization of such parses is higher, because of cursor sharing. In fact, the parse time increases linearly with
the number of child cursors per parent cursor. The parse time increases linearly because, during the parse, the SQL
engine has to check whether an already available child cursor can be reused. Therefore, the list of child cursors
must be scanned and every child cursor probed for compatibility. Simply put, many child cursors inhibit optimal
performance. Note that after the replacement of literals, all SQL statements have the same text. As a result, the library
cache contains a single parent cursor that has many or, in this case, thousands of child cursors.