Database Reference
In-Depth Information
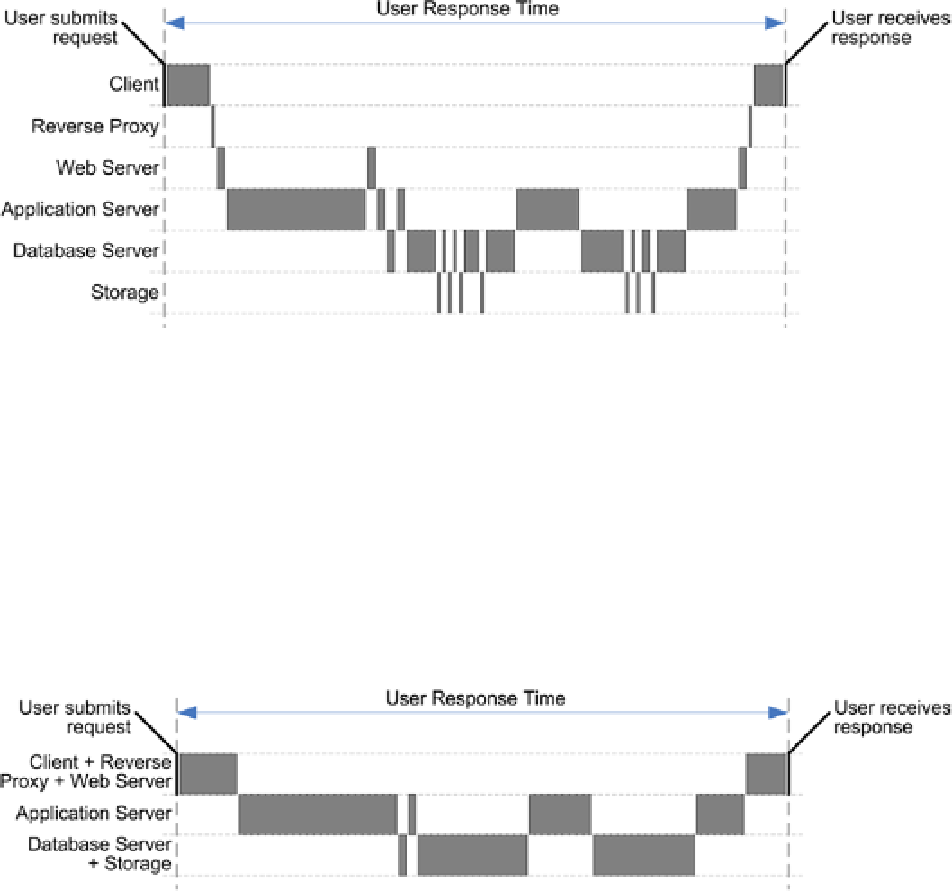
Figure 1-6.
The response time of a request broken up into all major components. Communication delays between
components are omitted
Once you know which components are involved and how much time is spent by each of them, you can further
analyze the problem by selectively gathering additional information only for the most time-consuming components.
For example, according to Figure
1-6
, you should worry only about the application server and the database server.
Fully analyzing components that are responsible for only a very small portion of the response time is pointless.
Depending on what tools or techniques you use to gather performance data, in many situations you will not be
able to fully break up the response time for every component as shown in Figure
1-6
. In addition, this is usually not
necessary. In fact, even a partial analysis, as shown in Figure
1-7
, is useful in order to identify which components may,
or may not, be mainly responsible for the response time.
Figure 1-7.
The response time of a request partially broken up by components
To gather performance data about problems, basically only the following two methods are available:
Instrumentation:
When an application has been properly developed, it is instrumented
to provide, among other things, performance figures. In normal circumstances, the
instrumentation code is deactivated, or its output is kept to a minimum to spare resources.
At runtime, however, it should be possible to activate or increase the amount of information
it provides. An example of good instrumentation is Oracle's SQL trace (more about that in
Chapter 3). By default it is deactivated, but when activated, it delivers trace files containing
detailed information about the execution of SQL statements.