Database Reference
In-Depth Information
The additional information needed by the query optimizer to get information about the nonuniform distribution
of data is called a
histogram.
Prior to version 12.1, two types of histograms are available:
frequency histograms
and
height-balanced histograms.
Oracle Database 12.1 introduces two additional types to replace height-balanced
histograms:
top frequency histograms
and
hybrid histograms
.
■
The
dbms_stats
package builds top frequency histograms and hybrid histograms only when the sampling
used for gathering the object statistics is based on
dbms_stats.auto_sample_size
(later in this chapter, the “Gathering
Options” section covers this topic).
Caution
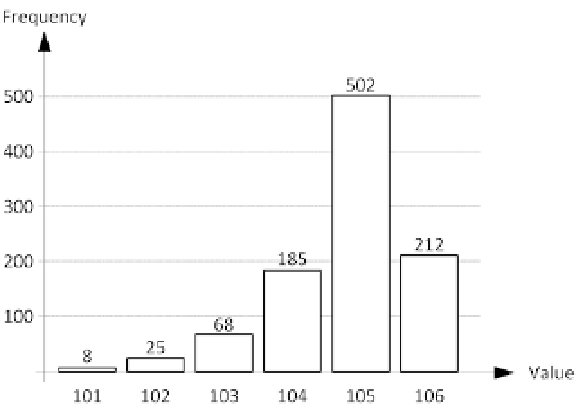
Frequency Histograms
The frequency histogram is what most people understand by the term
histogram.
Figure
8-2
is an example of this type,
which shows a common graphical representation of the data returned by the previous query.
Figure 8-2.
Graphical representation of a frequency histogram based on the set of data stored in the
val2
column
The frequency histogram stored in the data dictionary is similar to this representation. The main difference is that
instead of the frequency, the cumulated frequency is used. The following query turns the cumulated frequency into
the frequency by computing the difference between two consecutive bucket values (notice that the
endpoint_number
column is the cumulated frequency):
SQL> SELECT endpoint_value, endpoint_number,
2 endpoint_number - lag(endpoint_number,1,0)
3 OVER (ORDER BY endpoint_number) AS frequency
4 FROM user_tab_histograms
5 WHERE table_name = 'T'
6 AND column_name = 'VAL2'
7 ORDER BY endpoint_number;