Database Reference
In-Depth Information
use the
ash_activity.sql
script to display data similar to Figure
4-20
(notice that the first parameter specifies the
session ID):
SQL> @ash_activity.sql 232 all
TIME AvgActSes CPU% UsrIO% SysIO% Conc% Appl% Commit% Config% Admin% Net% Queue% Other%
----- --------- ------ ------ ------ ------ ------ ------- ------- ------ ------ ------ ------
19:10 0.2 11.1 88.9 0.0 0.0 0.0 0.0 0.0 0.0 0.0 0.0 0.0
19:11 0.2 8.3 91.7 0.0 0.0 0.0 0.0 0.0 0.0 0.0 0.0 0.0
19:12 0.1 0.0 100.0 0.0 0.0 0.0 0.0 0.0 0.0 0.0 0.0 0.0
19:13 0.2 7.1 92.9 0.0 0.0 0.0 0.0 0.0 0.0 0.0 0.0 0.0
19:14 0.2 0.0 100.0 0.0 0.0 0.0 0.0 0.0 0.0 0.0 0.0 0.0
19:15 0.1 33.3 66.7 0.0 0.0 0.0 0.0 0.0 0.0 0.0 0.0 0.0
19:16 0.1 0.0 100.0 0.0 0.0 0.0 0.0 0.0 0.0 0.0 0.0 0.0
19:17 0.2 0.0 100.0 0.0 0.0 0.0 0.0 0.0 0.0 0.0 0.0 0.0
19:18 0.2 0.0 100.0 0.0 0.0 0.0 0.0 0.0 0.0 0.0 0.0 0.0
19:19 0.2 10.0 90.0 0.0 0.0 0.0 0.0 0.0 0.0 0.0 0.0 0.0
19:20 0.1 0.0 100.0 0.0 0.0 0.0 0.0 0.0 0.0 0.0 0.0 0.0
SQL Statement Information
When you focus on a specific SQL statement, you can display detailed information about it either by clicking on its
SQL ID in one of the tables showing the top SQL statements (for example, Figures
4-17
and
4-21
) or by searching
for it via the Search SQL link in the Performance menu. By doing so, you'll access the SQL Detail page associated to
the selected SQL statement. Be aware that when several execution plans exist, you can select one of them with the
Plan Hash Value dropdown list positioned between the text of the SQL statement and the tabs. The SQL Detail page
provides, in addition to the text of the SQL statement, the following tabs:
•
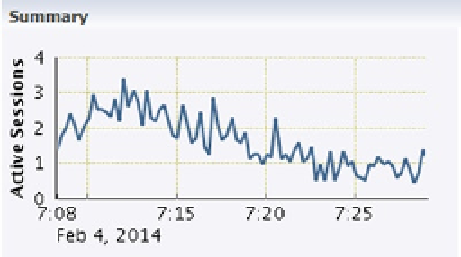
The Statistics tab shows a chart with the average number of active sessions executing the
SQL statement (Figure
4-23
), the execution statistics (Figure
4-24
), and general information
associated to the cursor associated to SQL statement. Note that the execution statistics
are cumulated values starting from the initial load of the cursor in the library cache. This
information can only be displayed if it hasn't been aged out from the library cache.
Figure 4-23.
The Summary chart of the Statistics tab shows the average active sessions related to a single SQL statement