Database Reference
In-Depth Information
SQL> @ash_top_actions.sql 2014-02-04_19:10:02.174 2014-02-04_19:15:02.174
Activity% DB Time CPU% UsrIO% Wait% Module Action
--------- ------- ---- ------ ----- ------------------------ ---------------------------
24.0 745 4.3 95.7 0.0 New Order getProductDetailsByCategory
23.8 738 6.0 94.0 0.0 New Order
14.6 452 1.5 98.5 0.0 Process Orders
10.2 317 0.0 100.0 0.0 Browse Products getCustomerDetails
8.3 259 1.2 98.8 0.0 New Order getCustomerDetails
6.8 211 2.8 97.2 0.0 New Customer
5.9 182 3.3 96.7 0.0 New Order getProductQuantity
1.6 51 37.3 3.9 58.8
1.6 50 0.0 100.0 0.0 Browse and Update Orders getCustomerDetails
0.8 24 45.8 0.0 54.2
Session Level Analysis
If you carry out an analysis at the session level, the starting point depends on whether the session still exists. If the
session exists, you can access information about it by searching the session through the Search Sessions menu item
in the Performance menu. Otherwise, you can follow one of the Session ID links on the Top Activity page, specifically
from the Top Sessions table.
Three sets of data are provided by the session-level activity page:
•
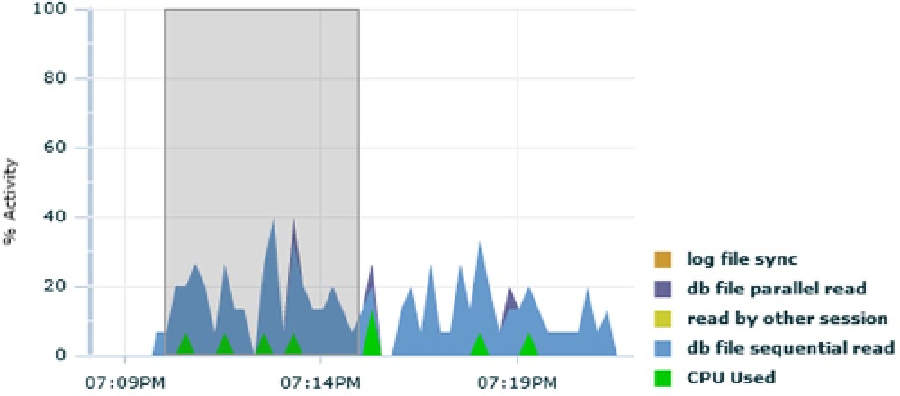
The activity chart (Figure
4-20
) shows the DB time broken up into CPU and wait events.
It shows up to one hour of data. If the activity is 0 percent, it means that the session is
completely idle. If the activity reaches 100 percent, it means that the session is completely
busy processing user calls.
Figure 4-20.
The session-level activity chart shows the CPU utilization and wait events related to a single session
•
The active session history aggregated data (Figure
4-21
) shows, for the 5-minute interval
selected in the activity chart, the most time-consuming SQL statements. For each of them, the
overall activity, the SQL ID, the execution plan hash value, as well as some session properties