Database Reference
In-Depth Information
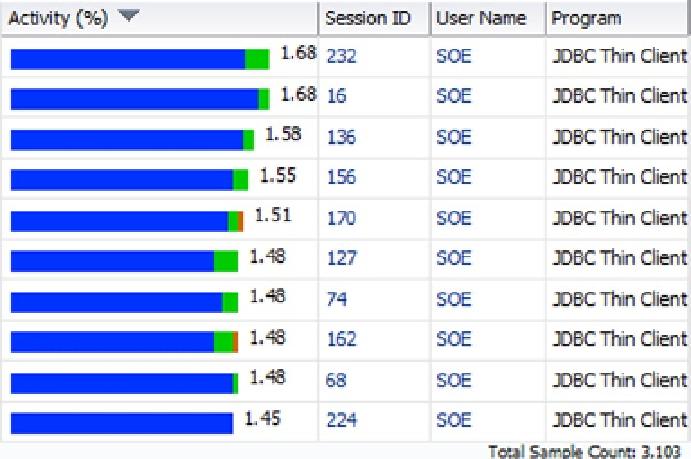
Figure 4-18.
The Top Sessions table shows the most time-consuming sessions
The aim of the activity chart is twofold. First, it allows you to have an idea of what's going on from a database
engine point of view. For example, according to Figure
4-16
, you can not only infer that the average number of active
sessions goes between 3 and 13 (hence, because the number of CPUs is 8, the database engine is moderately loaded),
but also that most of the DB time is spent in the User I/O class. Second, you use it to select the 5-minute interval
for which you want to display more details about the database load. Hence, if you aren't analyzing something that
happened at a specific moment, you usually select the period with the highest number of active sessions. In other
words, you select the period with the highest load.
If you don't have access to Enterprise Manager, to display the activity over the last hour you can use the
ash_activity.sql
script. The purpose of the script is to display the average number of active sessions, as well as the
percentage of contribution for each wait class. The following output is an example based on the same period as the
one shown in Figure
4-16
(note that two parameters set to
all
specify that the script doesn't restrict the output either
to a specific sessions or to a specific SQL statement); the only difference compared to Figure
4-16
is that the data is
aggregated at minute level:
SQL> @ash_activity.sql all all
TIME AvgActSes CPU% UsrIO% SysIO% Conc% Appl% Commit% Config% Admin% Net% Queue% Other%
----- --------- ------ ------ ------ ------ ------ ------- ------- ------ ------ ------ ------
19:04 3.8 6.2 93.8 0.0 0.0 0.0 0.0 0.0 0.0 0.0 0.0 0.0
19:05 3.6 8.0 92.0 0.0 0.0 0.0 0.0 0.0 0.0 0.0 0.0 0.0
19:06 5.6 4.8 95.2 0.0 0.0 0.0 0.0 0.0 0.0 0.0 0.0 0.0
19:07 3.4 7.9 92.1 0.0 0.0 0.0 0.0 0.0 0.0 0.0 0.0 0.0
19:08 6.0 5.0 92.5 0.0 2.5 0.0 0.0 0.0 0.0 0.0 0.0 0.0
19:09 7.5 6.9 93.1 0.0 0.0 0.0 0.0 0.0 0.0 0.0 0.0 0.0
19:10 11.2 3.7 96.3 0.0 0.0 0.0 0.0 0.0 0.0 0.0 0.0 0.0
19:11 10.4 4.5 95.5 0.0 0.0 0.0 0.0 0.0 0.0 0.0 0.0 0.0
19:12 10.9 2.9 97.1 0.0 0.0 0.0 0.0 0.0 0.0 0.0 0.0 0.0
19:13 9.8 6.5 93.5 0.0 0.0 0.0 0.0 0.0 0.0 0.0 0.0 0.0
19:14 9.2 3.8 96.2 0.0 0.0 0.0 0.0 0.0 0.0 0.0 0.0 0.0
19:15 8.6 5.2 94.8 0.0 0.0 0.0 0.0 0.0 0.0 0.0 0.0 0.0